- Fink 🧠
- Posts
- 🔔 The Veteran's All Weather Trading
🔔 The Veteran's All Weather Trading

Three days left 👀 until the new product launch from Macrodesiac partner Syscoin 👇
Something is coming... 👀@syscoin vs new #DeFi product = 🔥🔥🔥
We've partnered with some of the smartest devs in the industry to bring you the next groundbreaking product on $SYS.
Join us in Dubai on the 28th of March or keep an eye on our socials for the reveal. pic.twitter.com/jV14pCr8K5— Syscoin (@syscoin) March 17, 2022
The Veteran shares the results of his successful experiment to find stocks that are set to outperform 👇
Since the turn of the year equity markets have become increasingly erratic, being driven by swings in sentiment and diametrically opposed narratives.
Sometimes these narratives ignore facts that are obvious to even the most casual observer of price action and the macroeconomic background. Still 👇

That's not a climate in which to make long term plans or trades. Instead it's one in which we should keep a close eye on risk, leverage and overall exposure.
That said we are, or we aspire to be traders, which means we want to take advantage of opportunities as they present themselves.
A couple of weeks ago I downloaded some data on S&P 500 stocks with the intention of trying to identify stocks that could outperform as the market swung between overtly bullish and downright bearish.
My intuition was that stocks with high beta and directional momentum would be likely candidates.
(We'll explain beta shortly)
With that in mind, the first port of call was to make sure I captured data that covered these factors.
That may sound obvious but you'd be amazed how many times an idea pops into my head only to flounder because the right (or conclusive) data isn't at hand, or even available.
I use a number of data and price display services for that very reason. Don’t get me started on trying to blend data from two or more services into one excel or google sheet.

📌
Top tip: Plan or map out what data fields you will need to capture and set that up in your system of choice before downloading.
It will save you so much time and effort doing it that way than trying to add or amend fields on the hoof.
To identify my stock list I opted for the following fields:
1-day, 5-day, 1 and 3-month % change
RSI 14
Volume and 3-month average volume
Stock beta and alpha
Beta is a measure of the sensitivity of a stock to a change in the underlying index of which it is a member.
We can think of it as the portion of a given price move in that security that can be explained by the group.
i.e XYZ PLC went up or down X% because the S&P 500 moved by Y%.
Alpha is the portion of a stocks price change that we can explain by looking at the wider market because it's often unique or idiosyncratic to that stock.
Active managers and hedge funds often look for alpha as they believe it can provide them with an edge, a way to outperform and to do so in a way that's non-correlated to the performance of stock indices or other benchmarks.
In this instance, however, I wasn't looking for alpha.
Instead I wanted to try to identify stocks that would move in the same direction as the underlying index, the S&P 500. The direction of travel which on a given day would act as a proxy for investor sentiment.
I wanted to see stocks with positive momentum so I screened for stocks which had gains of 2.00% or more over the last month.
I plotted those changes against stock beta to create a bubble chart that looked like this.

I find bubble charts very useful as they provide a great way to spot outliers.
In this instance Oxydental Petroleum (OXY) stood out with a Beta of just over 2.0 and monthly gains of more than 40%.
We would later discover that none other than the sage of Omaha Warren Buffet had been adding to a substantial stake in the company.
With a bit more filtering I ended up with a list of stocks that I believed should perform well and potentially outperform on the upside when market sentiment was positive.
I performed these screens back on the 10th of March and shared this list in the Macrodesiac Premium stocks chat.
The image from that post is seen below 👇
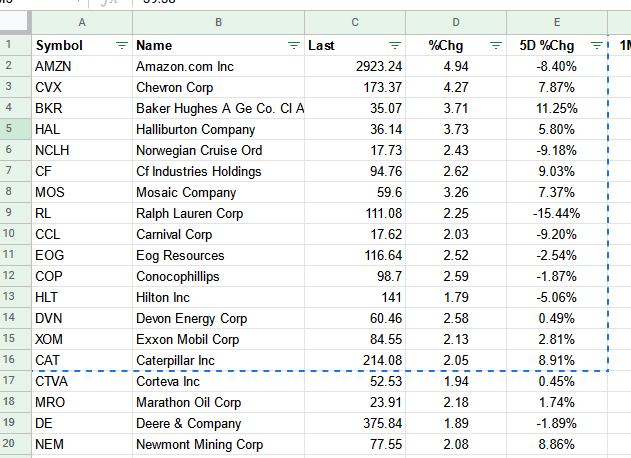
Let's examine the performance of these stocks since then.
The table below shows us the 5-day and 1-month percentage changes for those stocks.
These data were captured at 15.10 pm UK time on the 23rd of March 2022 👇

The average 5-day return for these stocks is +7.0%
The 5-day percentage change in the S&P at this point was +3.11%
What also stands out is that only 3 of the 19 stocks in the list had negative performance over that 5 day period.
By contrast, the average 5-day % change amongst S&P 500 stocks was +1.94% and the median return was +1.51%.
The mode or the most common value was +1.40%.
145 stocks in the S&P 500 index posted negative returns over that period.
Clearly, this was an experiment conducted on the fly. There has been no rigorous back-testing of the data or the methodology.
Even with those caveats in place I am inclined to believe that the strategy and the thinking behind it are correct or at the very least along the right lines.
The next step will be to identify a list of stocks that are predisposed to outperform on the downside when sentiment turns.
More on that in the coming days and weeks.
Don't know what financial news stories are important and what is complete bullsh*t? Hop onto our filtered news channel.
It's completely free 👇👇👇
Subscribe to our YouTube Channel and stay up to date with all of our videos as they're posted. We'll keep expanding and adding more formats as we go!
Check out our reviews on TrustPilot 👇👇👇