

The fourth way
Late on 12 November I posted this: The only way out of economic doom is Georgism. You need a land value tax and no taxes on capital and income, you just don't know it yet.
Did that sound mad to you? It's a big claim for two lines, so this report backs it up. Georgism comes from Henry George, an American economist who argued in 1879 that the state should raise its money from the value of land and leave work and investment alone.
Ever wondered why a plot in Clapham is worth more than the same plot in Burnley? It's because of what's around it, the Tube and the jobs. The owner didn't build any of that.
So the tax goes on the land, not the house on it. A land value tax takes a slice of that value every year and lets you keep what you earn and what you build.
Think of a market stall. The council charges for the pitch and the pitches by the entrance cost the most. Nobody charges the stallholder extra for selling more apples or putting up a nicer stall. A land value tax does that for the whole country.
If you've ever lost a family game of Monopoly to someone with hotels on Mayfair, you've had the lesson already. Monopoly grew out of The Landlord's Game. Lizzie Magie, a follower of Henry George, patented it in 1904 to show how rent flows to whoever owns the land (US patent 748,626).
It's also the follow-up to my Fix the UK report. Remember the textbook ways out of Britain's mess in that one? I said Britain had three and I'd take a fourth, tax the land and take the weight off work and investment. This is the fourth way in detail.
The idea in three lines
Tax the land. A yearly charge on the value of the plot, not the building on it.
Cut the taxes on work and investment. Stamp duty goes first, then council tax and business rates, then capital gains and income tax.
Do it as a swap. Phase it in over years so most people get back what they pay.
Honest up front. I think a land value tax would fix more of what's wrong with Britain than anything else on the table. Can it pay for everything on its own at today's level of spending? I don't think so and the where it gets hard section has the sums.
The case is older than income tax
Britain's first income tax came in 1799 (UK Parliament). Would it surprise you that the case for taxing land is older than that?
Thomas Aquinas
Thomas Aquinas, Summa Theologiae, Second Part of the Second Part, Question 66, Article 2
A health warning on this one. Aquinas never proposed a land tax and in the same article he defends owning property.
So why's he on the list? He drew the line Georgists still draw, between the right to own something and a duty in how it's used. If someone sends you a quote of Aquinas backing a land tax, it's made up.
Adam Smith
Adam Smith, The Wealth of Nations, Book V, chapter 2
He adds that taking part of it to pay for the state means “no discouragement will thereby be given to any sort of industry”. Not what you'd expect from the father of free market economics? He picked land as the best thing to tax.
Thomas Paine
Thomas Paine, Agrarian Justice
Paine's point was that the improvement belongs to the owner but the earth itself doesn't, so owners owe everyone else rent for it. Think of a rented allotment. The veg you grow is yours but the soil never was.
David Ricardo
David Ricardo, On the Principles of Political Economy and Taxation, chapter on taxes on rent
The landlord can't pass a land tax on to tenants or anyone else. Taxing land doesn't make any more of it, so rents are still set by what tenants will pay. That's why economists rate it so highly.
Then Churchill took on the landlords
By the late 1800s it had gone from economics books to a political movement. In 1909 a Liberal government tried to put it into law.
John Stuart Mill
John Stuart Mill, Principles of Political Economy, Book V, chapter 2
Mill wanted the state to take future rises in land value, what he called the unearned increment. He'd leave the value people had already paid for alone.
Think of the jump in value when a new station opens down the road. Mill would tax that jump, not the price you paid for the house. It's still one of the best ideas for getting started (the where it gets hard section).
Henry George
Henry George, Progress and Poverty, Book VIII, chapter 2
The line that started Georgism. One tax on land and nothing on wages or capital. Does that sound familiar? It's what I posted, 147 years later.
Leo Tolstoy
Leo Tolstoy, A Great Iniquity, first published in The Times, 1 August 1905
Still true. Bring it up at a dinner party and watch the faces.
Winston Churchill
Winston Churchill, King's Theatre, Edinburgh, 17 July 1909
Ever watched prices jump on your street after a new station or road went in? Churchill was talking about the owner who sits on a plot while the city grows round him. In the same speech the roads and trams get built at other people's cost “and all the while the landlord sits still”. Churchill was a Liberal minister backing Lloyd George's 1909 People's Budget, whose land taxes were the reason the House of Lords threw it out (UK Parliament).
Even Milton Friedman agreed
Think this is a lefty idea? Have a look at who's on this page.
Milton Friedman
Milton Friedman, interview in Human Events, 18 November 1978, reprinted in The Times Herald, Norristown, 1 December 1978
To be fair to him, his next least bad tax was a flat income tax above an allowance. He wanted income tax simple, he didn't want it gone.
Mirrlees Review
IFS, Tax by Design (the Mirrlees Review), chapter 16
The biggest independent review of the UK tax system in a generation, chaired by the Nobel winner Sir James Mirrlees. The same chapter says “there is no sound case for maintaining stamp duty and we believe that it should be abolished”.
Martin Wolf
Martin Wolf, chief economics commentator, Financial Times, 5 February 2023
He also says it's been politically impossible because millions of homeowners are now landowners too. He's right and the where it gets hard section deals with it.
What they all agree on
Strip out the old language and they say two things. Nobody made the land, so its value is a fair thing to tax. Taxing it doesn't put anyone off working or building, so it's the least damaging way to raise money.
Would anyone work fewer hours because the field next door went up in value? I can't see why they would.
We tax the things we want more of
Britain gets most of its money from people working and investing. Very little comes from land that sits there getting more valuable. Does that sound backwards to you? It does to me and it did to Adam Smith.
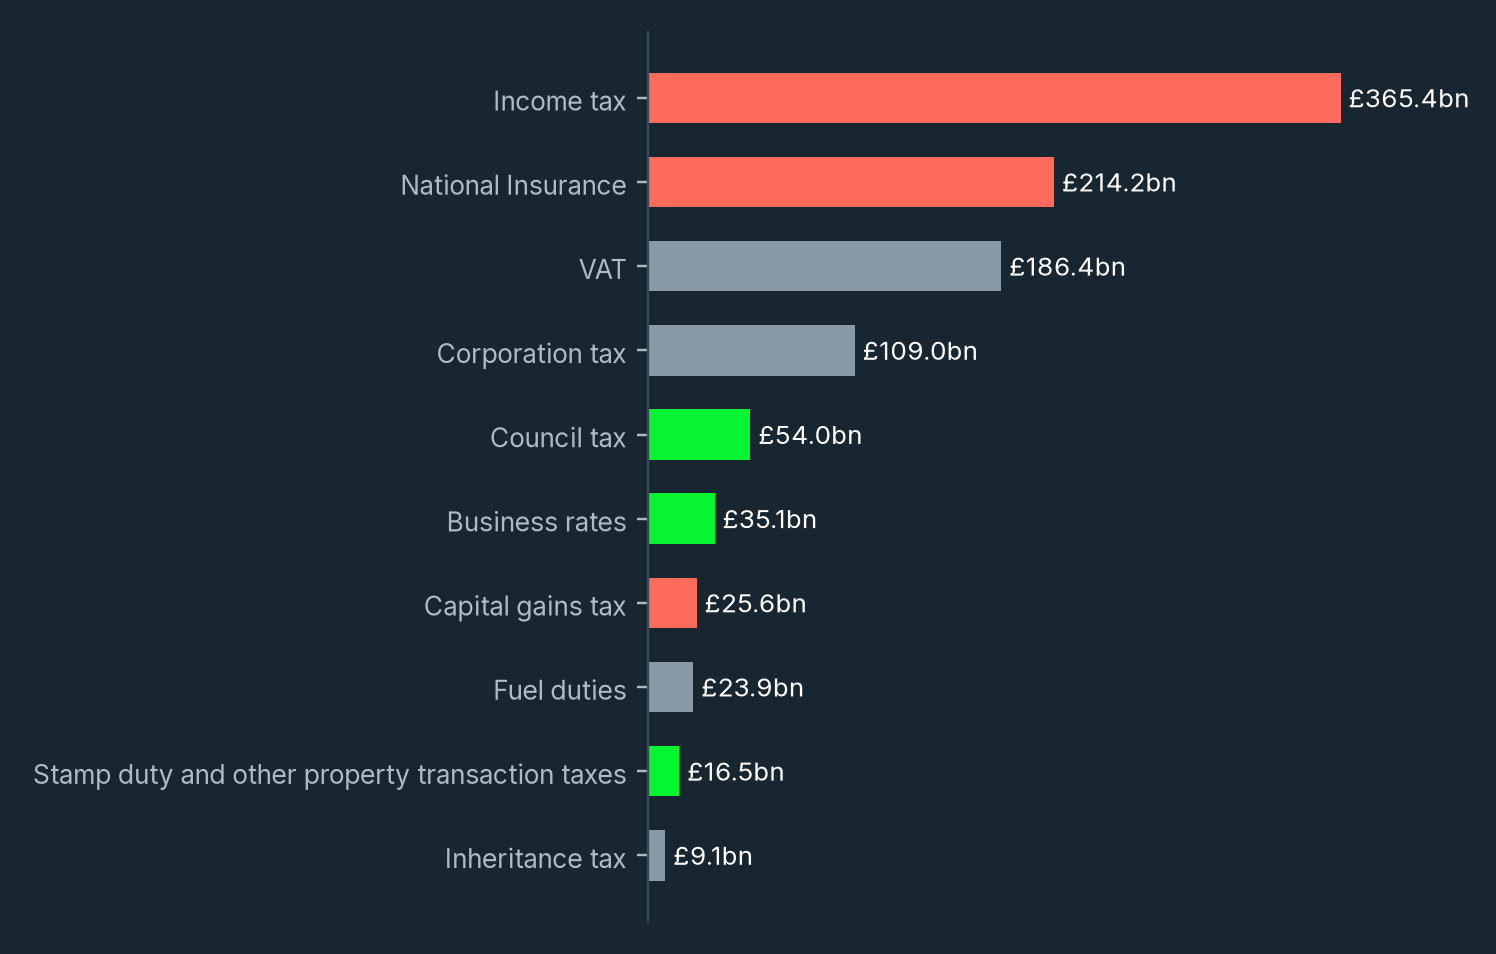
Income tax, National Insurance and capital gains tax bring in £605.2bn this year on the OBR's forecast, just over half of the £1,183bn total (my sum). Council tax, business rates and stamp duty bring in £105.6bn between them. All three are badly built.
Council tax in England still runs on what your home was worth on 1 April 1991 (gov.uk). When did you last pay a 1991 price for anything else? Business rates tax the building, so do up your shop and your bill goes up. It's like a gym charging you more for getting fitter. Stamp duty taxes you for moving house. A 2 percentage point rise in it cut household moves by about 37% (Hilber and Lyytikäinen, Journal of Urban Economics, 2017).
The Fix the UK report showed what the taxes on income do. Someone earning between £100,000 and £125,140 pays 60% on their next pound (gov.uk, my sum). A basic rate taxpayer on Universal Credit keeps about 32p of an extra pound. Would you take on an extra shift for 32p in the pound? I'm not sure I would. Tax is on course for a post-war record of 37.9% of GDP in 2027-28 (OBR).
Welfare is 11.1% of GDP this year (OBR). That's below the 12.3% peak in 2012-13, so it isn't a record. Even so, that's a lot of money going round in circles while land values do the compounding for whoever owns them.
Where it hurts
Housing
In 2025 the median home in England cost 7.6 times median full-time pay, £300,000 against £39,300 (ONS, March 2026). That's the best it's been since 2015, which tells you how bad it got. If your parents bought their first house decades ago, ask them what it cost against their pay at the time.
Land banking
The CMA found the 11 biggest housebuilders in Great Britain held about 1.17 million plots in their land banks in 2022 (CMA, February 2024). To be fair to them, the CMA mostly blamed the planning system rather than hoarding. Still, under today's rules an empty plot costs next to nothing to hold and gets more valuable while it waits.
It's like leaving your car in the best space of a busy car park for free while the price of that space keeps going up. Why would you ever move it? A land tax bills you every year whether you build or not, so building becomes the cheaper choice.
North and South
Fewer than 1 in 10 first-time buyers in the North paid stamp duty in the first half of 2026, against almost 8 in 10 in London (Zoopla). Stamp duty is already mostly a London tax. A land tax would follow land values the same way, heaviest where land is dearest and lightest in the places Britain keeps saying it wants to level up.
Money in the bank
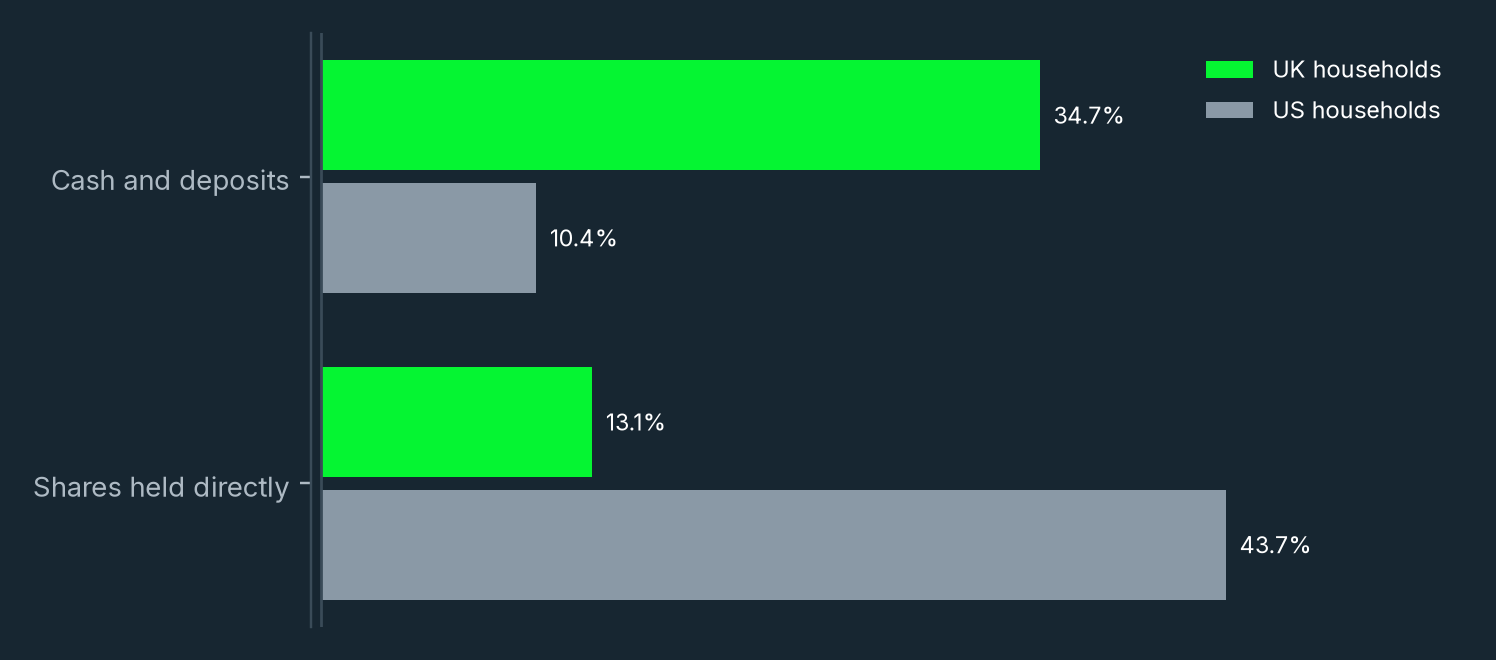
British households keep 34.7% of their financial assets in cash against 10.4% in the US. Only 13.1% is in shares held directly against 43.7% (OECD). We pile into bricks and the bank account and under-own businesses. Is that because Brits are scared of shares? I think it's mostly because the tax system points us that way.
It doesn't help that cash pays. Bank Rate is 4% (Bank of England, 5 November 2026), 10-year gilts yield above 5.2% and the government paid an average 4.993% to sell 2033 gilts on 12 November (DMO). Why back a business when the bank pays you to sit still? A system that taxes work and investment heavily and leaves land alone pushes savers the same way.
Tax the plot, leave the building alone
A land value tax is a yearly charge on what a plot would be worth with nothing on it, given what you're allowed to build there.
Buildings aren't taxed at all. Put a block of flats on a car park and your land tax doesn't change. Leave a site empty in the middle of Manchester and you pay the full whack anyway. The land can't move offshore either. Money can go to Dubai in an afternoon, a field in Kent stays where it is. Have you ever heard of anyone smuggling a field out of the country?
Mirrlees explains what happens next. The amount of land is fixed, so the tax shows up as a lower price for land and nothing else changes. Whoever owns the land on the day it's announced takes that hit once.
Think of two identical flats where one comes with a big yearly service charge. Buyers pay less for that one, so the owner on the day takes the hit and the next buyer doesn't.
It's already been done
Estonia
Has taxed land and only land since 1993. Councils pick the rate within national bands, 0.1% to 1% a year for residential land and up to 2% for other land in 2026 (Estonian Tax and Customs Board).
Denmark
Grundskyld is a council tax on land value, worked out as if nothing were built on the plot. Each council sets its own rate. In Horsens it's 0.89% of the taxable value (Danish Property Valuation Agency).
Pennsylvania
Towns have been allowed to tax land harder than buildings since 1913. Harrisburg has since 1975 and in 2026 taxes land at about six times the rate on buildings (landeconomics.org).
Does it actually work in practice? The evidence leans the way the theory says. A Lincoln Institute study of Pennsylvania found that taxing land more than buildings led to denser building, through more homes rather than bigger ones (Yang, 2014).
Where British politics is
The Lib Dems' 2024 manifesto promised to scrap business rates and replace them with a Commercial Landowner Levy. The Greens' 2024 manifesto called a land value tax their long-term aim. The Mirrlees Review wanted business rates and stamp duty on business property replaced by a land value tax. It wanted stamp duty scrapped altogether.
Fairer Share campaigns for something related but different, a 0.48% tax on the whole value of a home to replace council tax and stamp duty. It taxes the building too, so it isn't Georgism, but it gets rid of the two worst property taxes.
What it replaces
It only works as a swap. Every pound raised from land has to come off something else, or all you've done is invent another tax. Think of it as moving weight around in one rucksack, not strapping on a second rucksack.
Stamp duty first. £16.5bn this year (OBR). Scrap it and people move for work and downsize again. Right now it's a toll on your own front door.
Council tax and business rates. £89.1bn between them. They're already property taxes, so moving them onto land values is the natural next step.
Capital gains and dividend tax. Capital gains tax is £25.6bn. Dividend tax sits inside the income tax line. Cutting them rewards owning businesses over owning land.
National Insurance and income tax. Start with the £100,000 trap and the bottom of the ladder, then bring rates down as the land money grows.
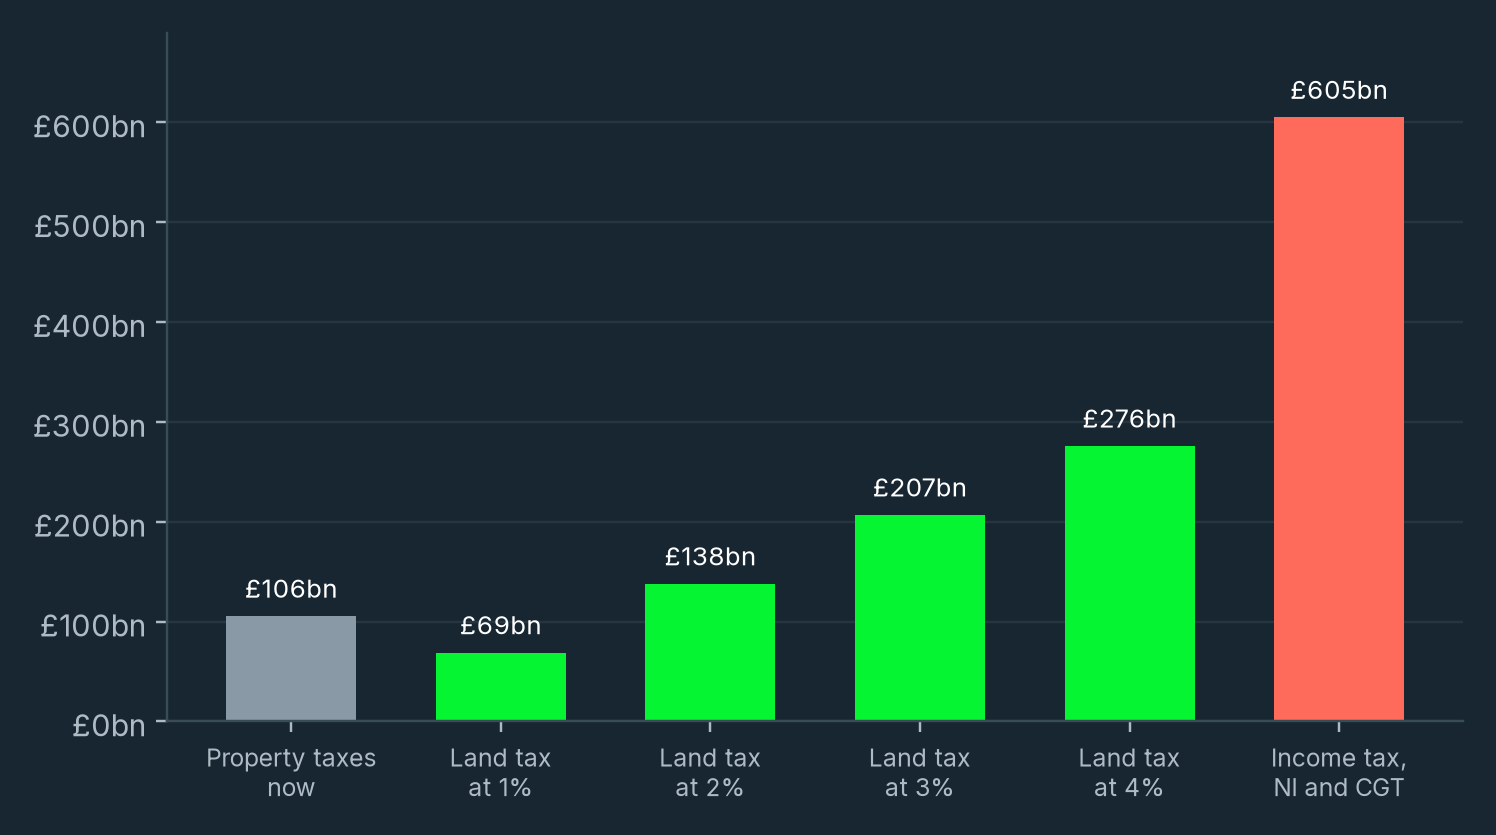
Covering the three property taxes takes about 1.5% of land value a year (my sum, £105.6bn on £6.9tn). For context, Mirrlees thought business land might need around 4% a year just to replace business rates.
At 3% a year you'd raise about £207bn on today's values. That covers the three property taxes and capital gains tax with about £76bn left over, just over a third of all National Insurance (my sum).
Scrapping income tax, NI and capital gains tax as well would take another £605bn. That's close to 9% of the value of all UK land, every single year. Could any land tax really take that much? That isn't happening and I'd rather say so than pretend.
Issue by issue
This is why I said it would sort most of Britain's problems. The table is our view of what changes, with the evidence on the pages before.
| Problem | Now | With a land value tax |
|---|---|---|
| Housing | Homes cost 7.6 times pay and stamp duty taxes every move | Land prices fall as the tax is priced in (Mirrlees). No stamp duty, so people move and downsize |
| Land banking | A plot with permission costs next to nothing to hold | Every empty year costs money, so build on it or sell it |
| The regions | Stamp duty is mostly a London tax and business rates hit high streets everywhere | The bill follows land value, so cheaper towns pay far less and business rates go |
| Work | 60% on the next pound between £100,000 and £125,140, around 68% on Universal Credit | Land money pays to cut those first |
| Investment | Improve a building and the rates go up. Gains and dividends taxed | Buildings and kit aren't taxed. Gains and dividend tax cut or gone |
| Complexity | Council tax on 1991 values plus stamp duty bands and reliefs | One value per plot that can't be moved offshore |
| Cash hoarding | 34.7% of household money sits in cash with the house as the pension | Cheaper land and lighter tax on shares tilt savings towards businesses |
The investing angle
Britain's tax system rewards sitting on property and punishes building a business or owning shares in one. Ever wondered why so much British money is in cash and houses and so little backs British companies? The tax system is a big part of the reason. Flip it and owning productive assets becomes the obvious choice, which is what a growing economy needs.
What it won't fix
It won't make power cheaper or planning faster. Large industrial users here pay 23.37p per kWh for electricity, the highest of 28 European countries against a median of 11.39p (DESNZ, second half of 2025). That needs its own fix and the Fix the UK report goes through it.
I'd stand by the housing and land banking rows all day. On income tax it gets you part of the way, which is the next page.
Where it gets hard
Can it replace income tax?
Not all of it, at today's spending. The sums on the what it replaces section say a land tax could replace council tax, business rates, stamp duty and capital gains tax. It could also pay for a real cut in National Insurance or income tax. The maths isn't controversial. UK land is worth £6.9tn and those taxes on income and capital raise £605bn a year.
The static numbers flatter it as well. The more you tax land the less it sells for, so a 3% tax on today's values raises less once prices adjust. It's the flat with the big service charge again. The bigger the yearly bill, the less anyone will pay for the plot. What you can really collect is the yearly rental value of land, not a percentage of a price that keeps falling.
So my honest view is that it covers the property taxes and capital gains tax. Once land prices adjust it could also cover about a tenth of income tax and NI by year 10 on my central sums (the bridging the gap section). Getting to zero needs a smaller state as well. I'd back both, but that's a separate argument.
All FINK calculations on £6.9tn of land (ONS) and 2026-27 receipts (OBR).
Asset rich, cash poor
Lots of older people live in valuable homes on small pensions. Say you're a retired teacher living alone in the family home. On paper the house is worth a fortune and the pension just about pays the bills. Where's a yearly land bill meant to come from?
Let people like that defer the tax until the house is sold or passed on. Collect it then. Fairer Share's plan uses deferral in the same way. Mill's version helps too, taxing only future rises in land value so nobody's hit for what they already paid.
Valuation
How do you value a plot when there's already a house sitting on it? Mirrlees called valuing land separately from buildings the biggest practical obstacle, because few empty plots sell. It isn't impossible. An estate agent prices your house off what sold down the street and a valuer can do the same for land.
The Valuation Office Agency already values every business property and Estonia now values each plot with statistical models. Valuations have to be kept up to date though. Estonia went from 2001 to 2022 without a new one while land values rose roughly sevenfold, which blunted the whole thing (Enough Berlin, March 2026).
Winners and losers
Owners of land on the day it's announced take a one-off hit. Phase it in over years as a straight swap, so most homeowners get their council tax and stamp duty back. The politics is the hardest part. Ask Altoona in Pennsylvania, which went land-only in 2011 and gave up in 2017. Martin Wolf's point stands, millions of voters own the land under their house.
Ten years, four phases
It has to be done in steps. Value the land before you tax it and only cut a tax once the land money to replace it starts to arrive.
| Phase | What changes | Taxes cut | Land tax | Gap a year |
|---|---|---|---|---|
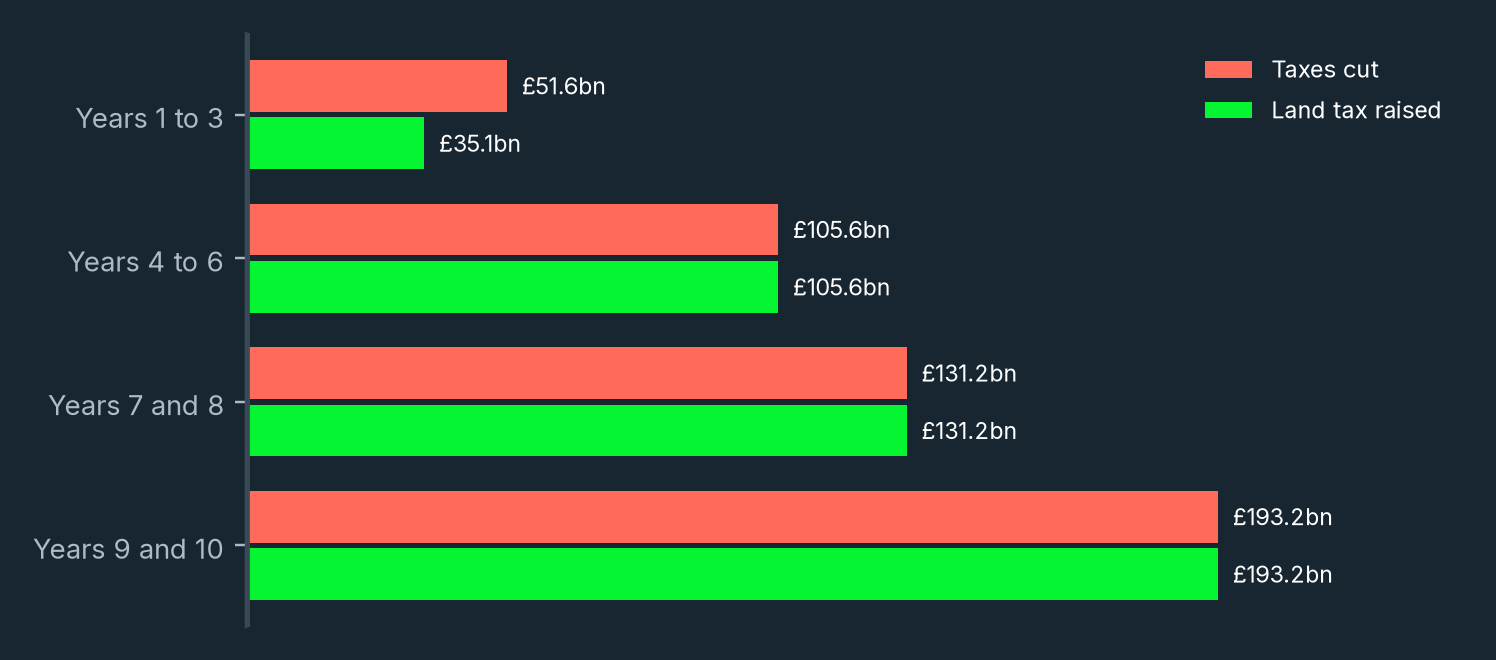
| Years 1 to 3 | Business rates swapped for a tax on business land. Stamp duty scrapped on day one. Valuing every home starts | £51.6bn | £35.1bn | £16.5bn |
| Years 4 to 6 | Council tax swapped for a land tax on homes, set high enough to cover stamp duty too | £105.6bn | £105.6bn | None |
| Years 7 and 8 | Capital gains tax goes | £131.2bn | £131.2bn | None |
| Years 9 and 10 | Income tax and NI cut with whatever the land tax raises on top | £193.2bn | £193.2bn | None |
Why stamp duty goes first
Tell people stamp duty is going next year and nobody buys a house until it's gone. Would you buy in December if you knew the tax vanished in January? So it has to go in one go on day one, before the land tax on homes is ready. That's where the gap comes from.
Mirrlees wanted the same swap. It said scrapping stamp duty on its own hands a windfall to people who already own. The money should come back from “other, more sensible, property taxes”.
Why business land goes first
The Valuation Office Agency already revalues every business property in England every three years. The latest list took effect in April 2026 (gov.uk). Mirrlees said the case for a land tax was strongest for business land and that's where to test it first.
The money columns are FINK's illustrative sums on OBR 2026-27 receipts in today's money, before land prices adjust and with no growth. Dividend tax sits inside income tax in the OBR figures. The model on the how the model works and three scenarios sections adds inflation and interest rates.
The shrinking base
A land tax makes land cheaper. Good for buyers, but it also means every extra 1% raises less than the one before.
Mirrlees says the tax gets “reflected one-for-one in a lower price of land”.
Think of land like a flat you rent out. What it's really worth comes from the rent it earns. So the honest way to size a land tax is on the rent land earns each year, not on today's price. Nobody publishes a UK figure for that. I've assumed land earns 4% of its value a year, about £276bn on the ONS's £6.9tn (my sum). Whatever share of that rent the tax takes, land values fall by about the same share. The table shows FINK's illustrative sums.
| Land tax raises | Share of rent | Land value | New rate | Rate on £6.9tn |
|---|---|---|---|---|
| £35.1bn | 13% | £6.0tn | 0.6% | 0.5% |
| £105.6bn | 38% | £4.3tn | 2.5% | 1.5% |
| £131.2bn | 48% | £3.6tn | 3.6% | 1.9% |
| £193.2bn | 70% | £2.1tn | 9.3% | 2.8% |
The 1.5% on the what it replaces section still raises the money, but only because it's charged on the old price. Once land reprices the same cash needs 2.5% of a smaller base. Charge 1.5% on the new values and you'd raise about £64bn, not £104bn (my sum).
If my 4% is wrong
At 3% the land rent is about £207bn a year and the three property taxes alone take half of it. At 5% it's about £345bn and they take under a third (my sums). The direction doesn't change. The size does.
The short-run gap
Stamp duty is gone from year 1 and the land tax on homes can't start until every plot has a value. That's £16.5bn a year in today's money for about three years. It's like a bridging loan when you buy before you've sold. You know the money's coming but you have to carry the gap for a while. With inflation and interest the model puts the bridge at £56bn by year 3.
Think valuing every plot is quick? Denmark froze its property valuations from 2013 to 2023 and started its new system in 2024 on provisional values (Statistics Denmark). Wales passed a law to revalue homes for council tax in 2028 and now plans to push it back to the next Senedd term. Its bands still use 2003 values (WalesOnline, 20 October 2026).
The gains come later. Moves pick up once stamp duty goes (Hilber and Lyytikäinen). The OECD ranks recurrent taxes on property as the least harmful to growth, with corporate and income taxes the most harmful (OECD, 2010). I haven't counted any of it.
The model
Static sums only go so far, so I built a simple 10-year model with inflation and interest rates in it. This is FINK's illustrative model, not an official forecast.
How the model works
It starts from the OBR's 2026-27 receipts and the ONS's £6.9tn of land. Tax bases and land rents grow with the OBR's forecast for nominal GDP. The bridge is borrowed at the OBR's gilt rate, which rises from 5.1% this year to 6.0% in 2031-32. After that the model holds everything flat.
Land is priced off its rent, so higher gilt yields and a higher land tax both push land values down. The land tax rate is fixed at the start so it covers the taxes removed each year from year 4 in the base case. Any shortfall is borrowed and the interest compounds. Every assumption and its source is on the model assumptions section.
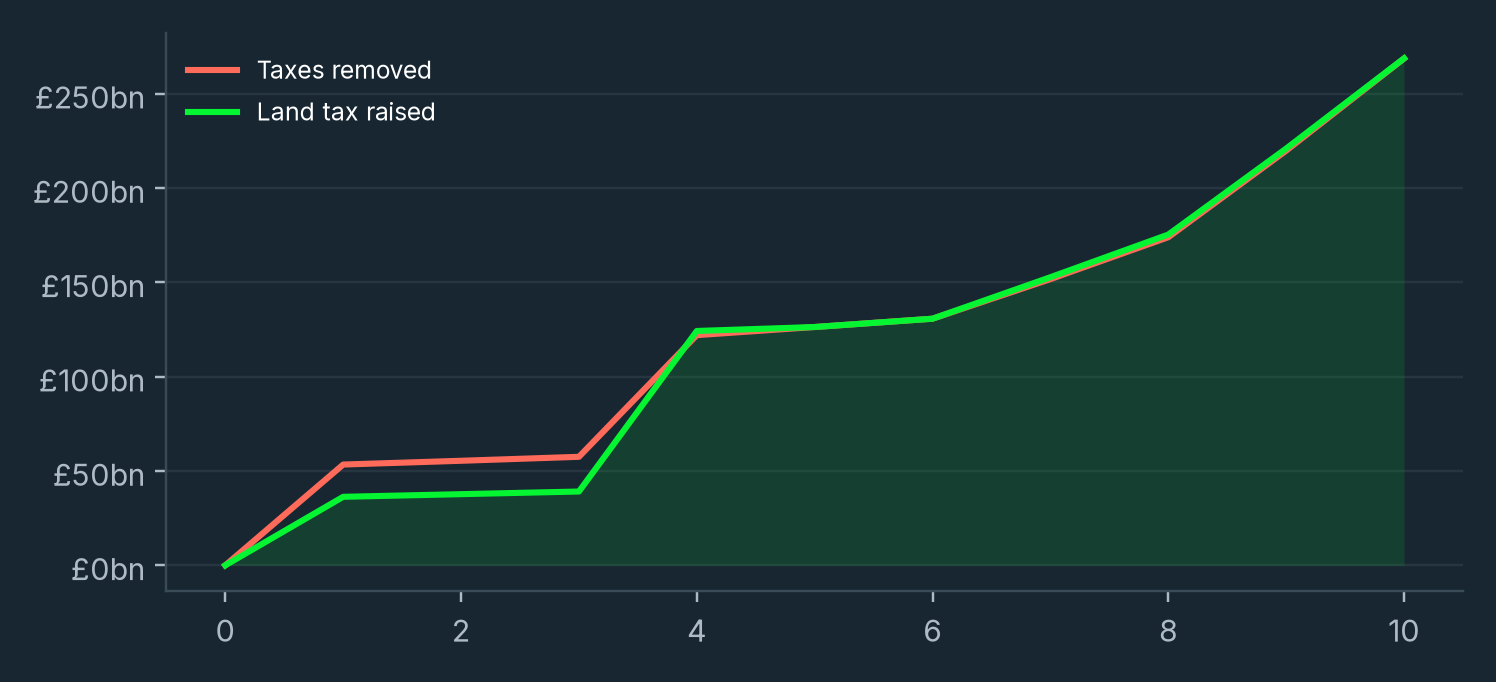
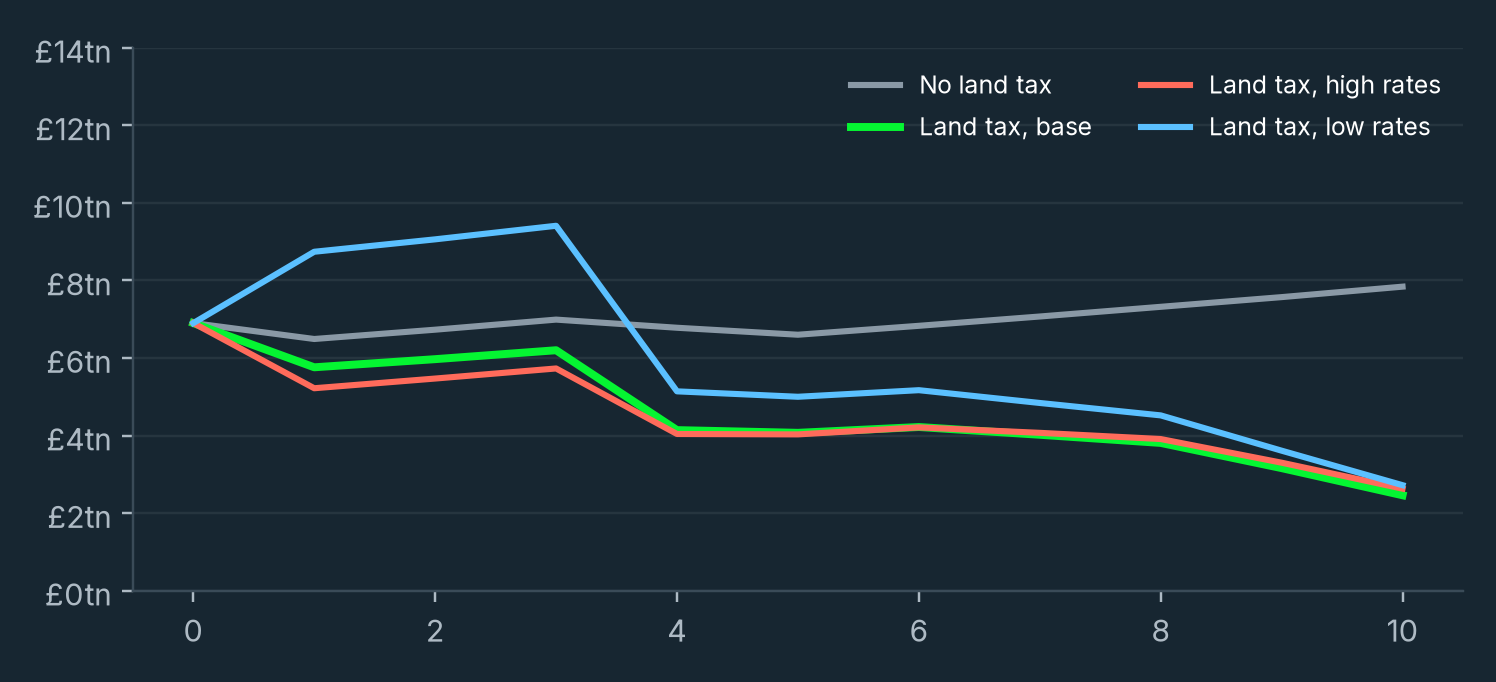
The land tax rate looks scary on its own. It goes from 3.0% of land value in year 4 to 10.9% in year 10. Does that sound mad? Land is worth far less by then, so that’s 69% of the year’s land rent. Land values end about 69% below where they’d be without the tax, £2.5tn against £7.8tn in cash terms.
Three scenarios
Same plan, three paths for interest rates. The tax rates are fixed at the start, so if rates move the land tax raises more or less than planned.
| Scenario | Year | Taxes removed | Land tax | Gap | Bridge debt | Land value |
|---|---|---|---|---|---|---|
| Base | Year 3 | £57.5bn | £39.1bn | £18.4bn | £56.2bn | £6.2tn |
| Base | Year 5 | £126.3bn | £126.3bn | None | £60.6bn | £4.1tn |
| Base | Year 10 | £268.6bn | £268.7bn | None | £77.1bn | £2.5tn |
| High rates | Year 3 | £59.2bn | £40.2bn | £18.9bn | £58.1bn | £5.7tn |
| High rates | Year 5 | £132.5bn | £124.8bn | £7.7bn | £80.7bn | £4.0tn |
| High rates | Year 10 | £295.7bn | £286.8bn | £8.9bn | £163.2bn | £2.6tn |
| Low rates | Year 3 | £57.5bn | £39.1bn | £18.4bn | £55.4bn | £9.4tn |
| Low rates | Year 5 | £126.3bn | £155.0bn | Surplus £28.7bn | In credit £2.1bn | £5.0tn |
| Low rates | Year 10 | £268.6bn | £296.7bn | Surplus £28.1bn | In credit £174.2bn | £2.7tn |
FINK's illustrative model, not an official forecast. Cash terms. Gap is the yearly shortfall before interest. Bridge debt includes interest. High rates means gilts 1.5 points higher with inflation and nominal growth 1 point higher. Low rates means gilts 1.5 points lower.
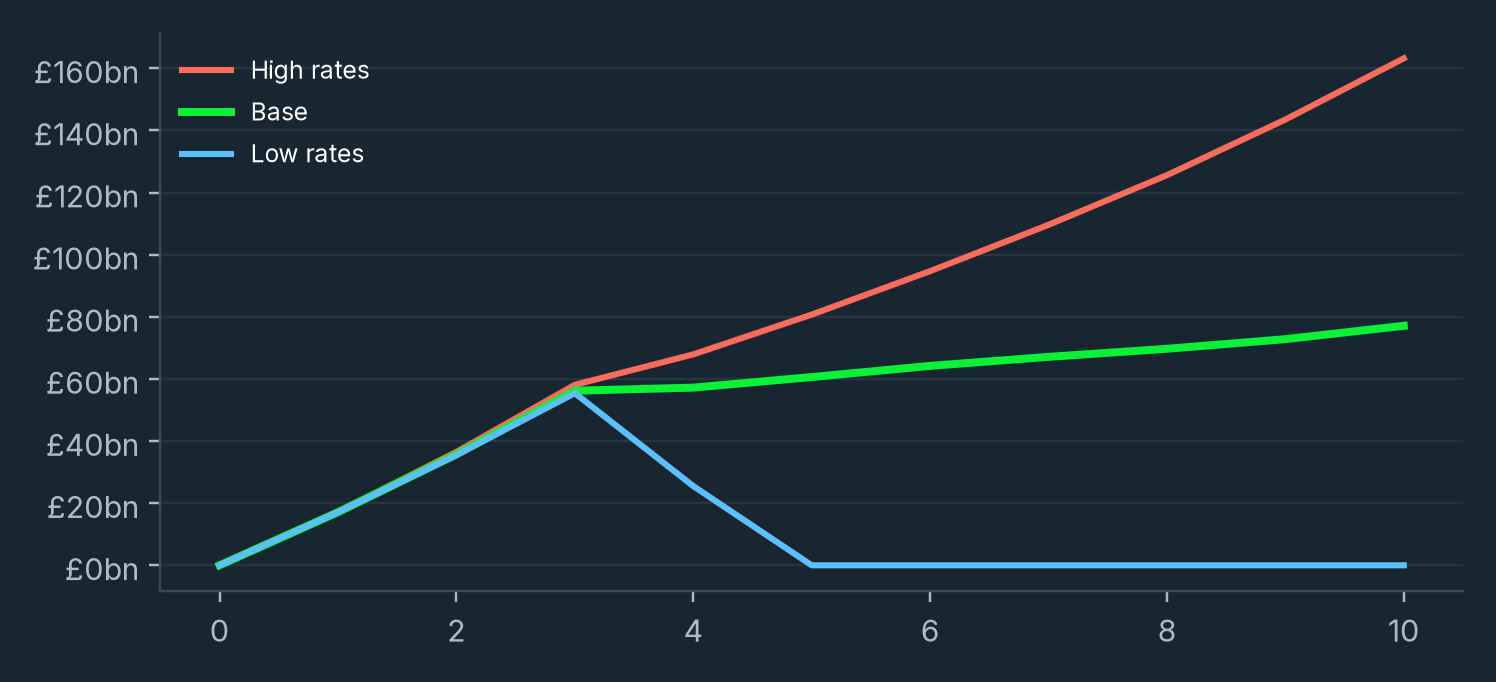
What the model says
The plan works if rates behave and gets expensive if they don't.
Base case. The gap is all in years 1 to 3, about £17bn to £18bn a year while stamp duty is gone and homes aren't yet taxed. That leaves £56bn of bridge debt by year 3. The land tax covers the swaps after that, but nothing pays the debt down. By year 10 it’s £77bn, £62bn in today’s money, costing £4.4bn a year in interest.
High rates. This is the danger. Ever taken a fixed rate mortgage and then watched rates jump at the end of it? This is that, for a whole country. Land is worth less, the land tax raises less than planned and inflation pushes up the cash value of the taxes being cut. The gap comes back at £6bn to £9bn a year from year 4 and the debt reaches £163bn by year 10 with £10.8bn a year of interest. That’s a permanent bill for a temporary plan. If gilts went there I’d slow the income tax cuts rather than borrow for them.
Low rates. They flatter it. Land is worth more, the same tax rates raise around £28bn to £32bn a year more than needed from year 4 and the bridge is paid off in year 5. Don't plan on it. The model's land values are very sensitive to rates and that cuts both ways.
Growth and deferral. Two more cases on the base path. If every £1 of income tax, NI and CGT cut brings back 10p through extra activity, year 10 debt is £52bn instead of £77bn. That 10p is my assumption, not a sourced figure. If a tenth of the land tax is deferred until homes are sold, the debt is £216bn by year 10, with £139bn of deferred bills still to collect.
My read. A land tax can carry the property taxes, CGT and about a tenth of income tax and NI inside 10 years. The bridge is affordable at today's rates and not at much higher ones. So the order matters more than the speed. Swap first, keep the borrowing small and only cut income tax when the land money is already in. It's how you'd redo a kitchen. You don't rip the old one out until the money for the new one is in the bank.
Rates and the year 10 gap
| Year 10 land tax rate | Gilts 1.5 points lower | OBR gilt path | Gilts 1.5 points higher |
|---|---|---|---|
| 6.9% | £8.6bn | £41.4bn | £66.8bn |
| 8.9% | Surplus £12.7bn | £17.7bn | £42.1bn |
| 10.9% | Surplus £28.1bn | None | £23.1bn |
| 12.9% | Surplus £39.7bn | Surplus £13.8bn | £8.0bn |
Yearly gap in year 10, cash terms, before interest. Only gilt rates move in this grid. Years 1 to 9 follow the base policy path.
Bridging the gap
Every way through the first three years costs something. These are the options with the downside left in.
| Option | For | Against |
|---|---|---|
| Swap first, cut later | No tax is cut until the land money to replace it arrives. No gap after year 3 | Slow. Voters see the new bill first |
| Borrow for three years | Stamp duty goes on day one | 10-year gilts yield above 5.2%. The model has £56bn of debt by year 3 and £3bn to £4bn a year of interest from then on |
| Phase stamp duty down | Cuts the gap to about £33bn over three years (my sum) | Buyers wait for the next cut, so moves stall |
| Defer bills for older owners | Nobody's forced to sell. Denmark lets owners freeze land tax rises until they move. California lets low-income over-62s postpone property tax at 5% interest | The money comes in years later, when the home is sold or passed on |
| Cap yearly rises | No shock bills. After the 2026 revaluation England capped first-year business rates rises at 5% to 30% (gov.uk) | Slows the money in. The 2026 business rates support package costs £4.3bn (gov.uk) |
| Spend less | Shrinks the gap for good | Finding £16.5bn a year is hard |
| Keep income tax for longer | No borrowing needed | The taxes doing the most damage stay put |
What I'd do
Swap first and cut later. Business land in years 1 to 3, stamp duty gone on day one and the gap covered by spending restraint with a small amount of borrowing. Older owners can defer their bills with interest and every rise gets phased in with a cap.
I'd be careful with the borrowing. The OBR has debt interest at £124bn this year and says a one point change in interest rates moves that by £16bn. The government paid an average 4.993% to sell 2033 gilts on 12 November (DMO). I'd borrow for the gap, never for the income tax cuts.
Year 10
In the base model the land tax raises about £269bn a year by year 10, about £218bn in today’s money. That covers council tax, business rates, stamp duty and capital gains tax, then a tenth of income tax and NI. It takes about 69% of land rent to get there. Growth from lower taxes on work would add to that but the core case doesn't count it.
Three flat tax plans
A land tax pays for the property taxes. How far can it carry income tax as well? I ran three flat tax plans through the same model so you can see them side by side. All three scrap stamp duty, business rates and council tax and cut CGT to 5%.
Plan A, Flat 20. 20% on everything over £12,570, no taper and no 40p or 45p bands. NI stays and the land tax takes up to 70% of land rent.
Plan B, Flat 10. The same at 10%, a land tax up to 85% of rent and spending cuts to close the gap.
Plan C, Flat 15. 15% over a £14,000 allowance and a negative income tax that keeps today’s £5,099 floor. It adds a 2% health levy on the Australian model, the land tax up to 85% of rent and cuts for the rest.
Plans A, B and C side by side
| Year 10, base case | Plan A: Flat 20 | Plan B: Flat 10 | Plan C: Flat 15 |
|---|---|---|---|
| Income tax | 20% over £12,570 | 10% over £12,570 | 15% over £14,000 |
| Negative income tax | None | None | 40.6%, keeps the £5,099 floor and replaces the UC standard allowance |
| Health levy | None | None | 2% over £14,000 with an insurance rebate and an opt-out surcharge, £35bn net |
| Land tax | 11.5% of value, 70% of rent | 28.3% of value, 85% of rent. Needs 117% | 28.3% of value, 85% of rent. Needs 102% |
| Land value | £2.4tn | £1.2tn | £1.2tn |
| Gap before cuts | None | £129bn | £68bn |
| Spending cut | None | £129bn, 2.8% of GDP (£104bn in today’s money) | £71bn, 1.6% of GDP (£58bn in today’s money) |
| Debt | £80.5bn and rising | £80.5bn with the cuts, £313bn without | £53.6bn, flat since year 3 |
| Interest | £4.6bn a year | £4.6bn a year | £3.2bn a year, paid from the cuts |
| At £30,000 | None | +£1,743 a year | +£766 a year |
| Main risk | Gilts and growth. No growth and high rates means a £31bn gap and £130bn of debt | The cuts. Without them debt hits £313bn and keeps climbing | Growth. With no growth effects the cut is £84bn in today’s money |
FINK's illustrative model, base rates, central growth effects, cash terms unless marked, year 10 is 2036-37. Plan A only balances at 70% of land rent with a 21.4% rate before growth effects and 19.9% with them.
Plan C, the one I’d pick
Plan A funds itself but gives someone on £30,000 nothing. Plan B needs cuts nobody can find. So I built one in between and tuned it until the debt stopped growing. Plan C keeps today’s benefit floor and pays for it with an Australian-style health levy.
Plan C has five dials and turning one up means turning another down. The flat rate stays at 15% and the allowance goes up to £14,000 for everyone. The negative income tax pays 40.6% of the gap below £12,570. So a single adult with no income still gets £5,099 a year, the same as the UC standard allowance today.
A 2% health levy on income over £14,000 helps pay for it, with a rebate for people who buy private hospital cover and a surcharge for high earners who don’t. After the levy a £30,000 earner keeps £766 a year more and a £60,000 earner £3,612.
The land tax goes to the 85% cap. Spending cuts close the rest and from year 4 they also pay the interest on the bridge, so the debt sits at £53.6bn from year 3. In today’s money that’s £43.5bn by year 10 and it keeps shrinking against GDP.
What the dials do
| Allowance, NIT and levy | Floor with no income | Gain at £30,000 | Gain at £60,000 | Cut, central growth | Cut, no growth |
|---|---|---|---|---|---|
| £14,000, NIT 20%, no levy (lower floor) | £2,514 | +£1,086 | +£4,532 | £45bn | £72bn |
| £14,000, NIT 20%, levy | £2,514 | +£766 | +£3,612 | £18bn | £44bn |
| £14,000, NIT 30%, levy | £3,771 | +£766 | +£3,612 | £37bn | £64bn |
| £12,570, NIT 40.6%, levy | £5,099 | +£523 | +£3,369 | £46bn | £72bn |
| £14,000, NIT 40.6%, no levy | £5,099 | +£1,086 | +£4,532 | £84bn | £112bn |
| £14,000, NIT 40.6%, levy (Plan C) | £5,099 | +£766 | +£3,612 | £58bn | £84bn |
| £15,000, NIT 40.6%, levy | £5,099 | +£936 | +£3,782 | £66bn | £92bn |
Flat rate 15% in every row. Gains are after the levy where there’s one. Cuts are year 10 in today’s money, base rates, including the bridge interest. The floor is the NIT for a single adult with no income. UC pays £5,099 today. FINK's illustrative model.
Every £1,000 on the allowance costs about £8bn a year in cuts by year 10. Every 10 points on the NIT costs about £19bn, because it’s paid per adult and plenty of adults with no income of their own aren’t on UC today. The levy is worth about £27bn of cuts by year 10.
The honest trade. A 20% NIT would cost about the same as the standard allowance it replaces, but a single adult with nothing coming in would get £2,514 a year instead of £5,099. Could you live on that? That’s a benefit cut for the poorest and I didn’t want to defend it. Keeping the floor adds about £40bn to the year 10 cut. The levy pays back about £27bn of that. So Plan C now needs £58bn of cuts by year 10 in today’s money, against £45bn with a 20% NIT and no levy.
Help with rent, children, disability and caring stays. Paying it per household like UC would be cheaper, but I can’t cost that with public data.
Who wins and who loses
Take-home pay for an employee this tax year, today and under each plan once it’s fully in. Where do you sit on this table?
| Pay | Today | Plan A | Plan B | Plan C |
|---|---|---|---|---|
| £30,000 | £25,120 | £25,120 None | £26,863 +£1,743 | £25,886 +£766 |
| £60,000 | £45,357 | £47,303 +£1,946 | £52,046 +£6,689 | £48,969 +£3,612 |
| £150,000 | £91,286 | £117,503 +£26,217 | £131,246 +£39,960 | £121,869 +£30,583 |
Take-home with the change against today underneath. 2026-27 rates outside Scotland: £12,570 allowance tapered from £100,000, 20%, 40% and 45% bands, employee NI at 8% to £50,270 and 2% above. Earnings only. All three plans keep NI. Plan C includes the 2% health levy. A £150,000 earner without private hospital cover would also pay the 1.25% surcharge, so their gain would be £28,708. My sums.
Plan A leaves the £30,000 earner exactly where they are, because they already pay 20%. Plan C gives them £766 a year (about £64 a month) and £3,612 at £60,000. The gains still get big fast at the top. At £150,000 Plan C is worth £30,583 a year after the levy, because the 40p, 45p and 60p rates all go. That’s the political problem with any flat tax. So who ends up paying? The land tax lands hardest on the same people, since they own most of the valuable land.
The three rate paths
| Plan and rates | Debt year 3 | Debt year 5 | Debt year 10 | Interest year 10 | Land tax year 10 | Cut year 10 |
|---|---|---|---|---|---|---|
| A base | £53.6bn | £60.2bn | £80.5bn | £4.6bn | 11.5% of value | None |
| A high rates | £55.4bn | £64.0bn | £91.9bn | £6.4bn | 12.7% of value | None |
| A low rates | £52.8bn | £57.6bn | £71.8bn | £3.1bn | 8.1% of value | None |
| B base | £53.6bn | £60.2bn | £80.5bn | £4.6bn | 28.3% of value | £129bn |
| B high rates | £55.4bn | £64.0bn | £91.9bn | £6.4bn | 31.2% of value | £142bn |
| B low rates | £52.8bn | £57.6bn | £71.8bn | £3.1bn | 19.8% of value | £129bn |
| C base | £53.6bn | £53.6bn | £53.6bn | £3.2bn | 28.3% of value | £71bn |
| C high rates | £55.4bn | £55.4bn | £55.4bn | £4.2bn | 31.2% of value | £79bn |
| C low rates | £52.8bn | £52.8bn | £52.8bn | £2.4bn | 19.8% of value | £70bn |
Central growth. Plan B's cuts close each year's gap from year 4. Plan C's also pay the interest, so its debt stays at the year 3 level. Land is priced off gilt yields, so rates differ by path.
Where the cuts come from
Plan B needs about £104bn a year of spending cuts by year 10 in today’s money. Plan C needs £58bn. With no growth effects it’s £135bn and £84bn.
For scale, the Conservatives say their Welfare that Works plan saves £36.1bn a year. The IFS worked out that’s 21% of the £173bn working-age benefit bill expected in 2029-30. It also said more than half rests on two measures with big uncertainties and that the savings are at the more uncertain end of the spectrum (IFS, 10 November 2026).
Plan B needs nearly three times that. Plan C needs about 1.6 times it with central growth. That’s hard, but it’s within sight of one party’s actual welfare plan, not a number nobody has ever written down. If growth comes in low it’s £68bn and if it comes in high it’s £37bn.
The OBR has total public spending at £1,449bn this year, 45.6% of GDP. Welfare is £353bn of that, or 11.1% of GDP. The OBR calls that high by historical standards, though it’s below the 12.3% peak in 2012-13. Health-related welfare is forecast to hit 3.2% of GDP by 2031-32. I’m not going to invent a list of cuts. Anyone who tells you it’s easy hasn’t added it up.
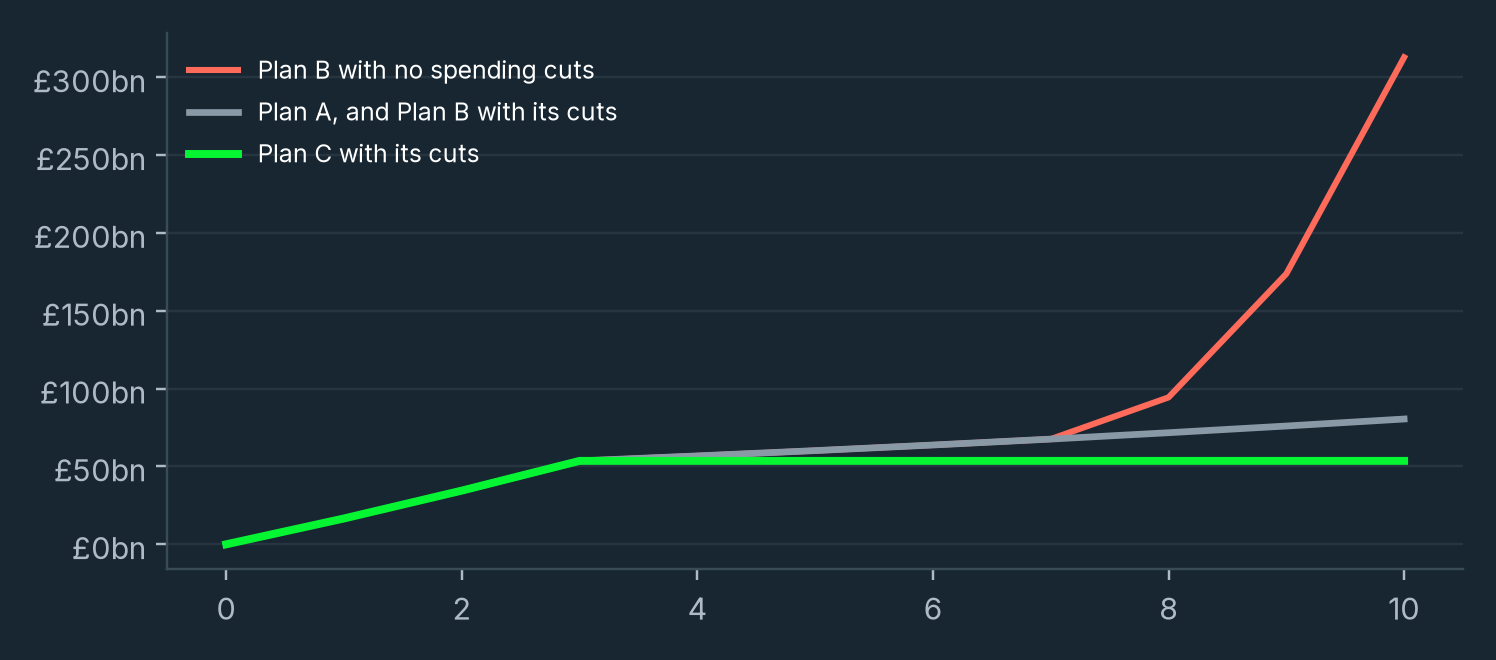
My read Plan A is a tax reform. Plan B is a tax reform plus a cut of nearly 3% of GDP that nobody has costed. Plan C is a tax reform plus a cut of about 1.6% of GDP and it still pays today’s benefit floor. That’s the only one I’d take into a room with the Treasury.
Productivity and jobs
Lower taxes on work and business should mean more of both. The model has two growth channels for this.
Investment. Business rates are partly a tax on buildings and machinery, so scrapping them cuts the cost of capital. And a tax on land doesn’t put anyone off building. I convert the cut into extra investment using the OBR’s own method for full expensing. On that method a 2.4% cut in the cost of capital adds about 0.2% to GDP in the long run. UK firms invest 11.1% of GDP, second lowest in the G7 (IPPR).
Work. Would you pick up more hours if you kept more of each pound? Lower marginal rates mean more hours and more people in work. I calibrate this on the OBR’s NI costings, where a 2p cut raised hours by 0.3%, about 94,000 full-time equivalents. The extra GDP is taxed at today’s rates less the taxes removed.
| Year 10, base rates | GDP level | From investment | Extra full-time jobs | Productivity, pp a year | Extra tax | Debt | Cut needed, cash |
|---|---|---|---|---|---|---|---|
| Plan A, low | +0.59% | +0.08% | 99,000 | +0.03 | £8bn | £93bn | None |
| Plan A, central | +1.24% | +0.23% | 198,000 | +0.06 | £17bn | £80bn | None |
| Plan A, high | +2.52% | +0.50% | 396,000 | +0.13 | £35bn | £76bn | None |
| Plan B, low | +0.92% | +0.08% | 259,000 | +0.01 | £11bn | £83bn | £144bn |
| Plan B, central | +1.92% | +0.24% | 519,000 | +0.03 | £23bn | £80bn | £129bn |
| Plan B, high | +3.92% | +0.55% | 1,038,000 | +0.06 | £47bn | £76bn | £98bn |
| Plan C, low | +0.69% | +0.08% | 149,000 | +0.02 | £9bn | £55bn | £84bn |
| Plan C, central | +1.46% | +0.23% | 299,000 | +0.05 | £19bn | £54bn | £71bn |
| Plan C, high | +2.97% | +0.53% | 597,000 | +0.11 | £38bn | £51bn | £46bn |
FINK's illustrative model. Productivity is GDP per hour, averaged over 10 years. No growth effects: Plan A debt £115bn, Plan B cut £166bn, Plan C cut £104bn. Sources on the plan assumptions section.
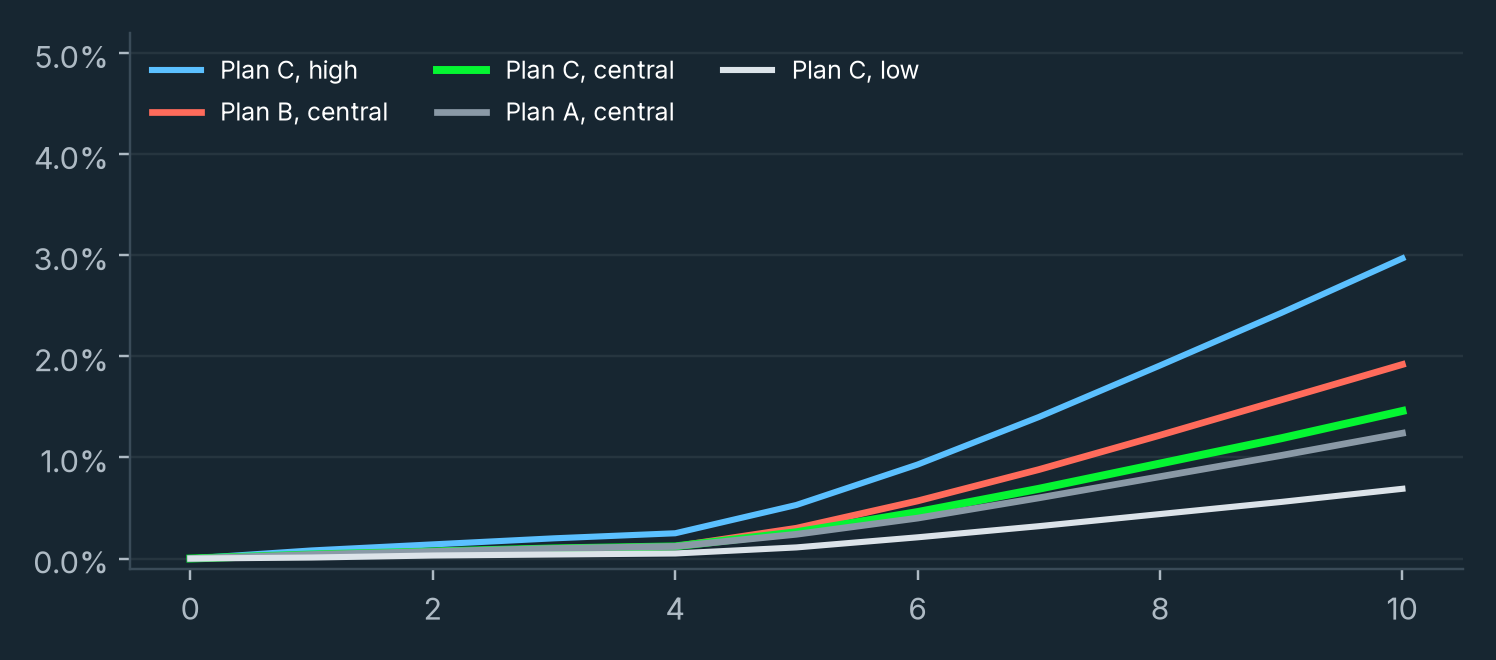
Why the levy costs Plan C some growth. The 2% levy takes its marginal rate to 25% for most earners, including NI, so the work response is smaller. By year 10 that’s +1.46% of GDP and 299,000 extra full-time jobs, against +1.59% and 363,000 without the levy.
The caveat. Most of the gain is more hours, not more output per hour. The investment channel is small and slow, as the OBR finds. Growth closes Plan A’s gap and doesn’t rescue Plan B. For Plan C it’s the difference between £37bn and £68bn of cuts in today’s money.
A negative income tax
Milton Friedman’s answer to the welfare trap was to run benefits through the tax system. Below a break-even income you get paid instead of paying.
Milton Friedman
Milton Friedman, Capitalism and Freedom, 1962, chapter 12, The Alleviation of Poverty
I tested it on both plans. Every adult aged 16 to 64 with own income under £12,570 gets the NIT rate times the shortfall. At 20% that’s up to £2,514 a year. At 40.6% it’s up to £5,099, the same as the UC standard allowance for a single adult today. At 50% it’s up to £6,285. It replaces the Universal Credit standard allowance and the last income-based legacy benefits, £29.7bn this year (DWP). Help with rent, children, disability and caring stays. So do pensions. Plan C now has the 40.6% version built in.
| 2026-27 | NIT at 20% | NIT at 40.6% (Plan C) | NIT at 50% |
|---|---|---|---|
| Gross cost | £29.1bn | £59.1bn | £72.8bn |
| Benefits replaced | £29.7bn | £29.7bn | £29.7bn |
| Net cost, no change in work | Saves £0.5bn | £29.4bn | £43.1bn |
| Net cost, central work response | £3.8bn | £38.3bn | £54.1bn |
| Net cost, SIME/DIME response | £9.1bn | £48.9bn | £67.2bn |
| Single adult with no income | £2,514 against £5,099 on UC today | £5,099, the same as UC today | £6,285 against £5,099 |
Covers 10.8m adults aged 16 to 64 not in work, 3.2m employees and 1.5m part-time self-employed under £12,570 (ONS, ASHE). Their average own incomes are my assumptions. Paid per adult, so a couple on UC today (£8,004 a year) would get up to £12,570 at 50%. FINK's illustrative model.
Work incentives at the bottom
The point of a NIT is the withdrawal rate. How much of an extra £1 of earnings do you lose today and how much would you lose with a NIT? The table below shows you both.
| Extra £1 earned | Today | NIT at 20% | NIT at 40.6% (Plan C) | NIT at 50% |
|---|---|---|---|---|
| Single, no children, earning under £9,271 | 55% | 20% | 40.6% | 50% |
| Single, earning £9,271 to £12,570 | 0% | 20% | 40.6% | 50% |
| Over £12,570, still getting UC help with rent or children | 67.6% | 67.6% under A, 63.1% under B | 66.3% under C, including the levy | Same as NIT at 20% |
| £12,570 to £50,270, no UC | 28% | 28% under A, 18% under B | 25% under C above £14,000, including the levy | Same as NIT at 20% |
Withdrawal rate on gross earnings, including income tax, employee NI and the 55p UC taper (gov.uk). Single adult aged 25 or over with no children or housing costs in the first two rows. My sums.
A 20% NIT is the better incentive and roughly pays for itself. But it cuts the floor from £5,099 to £2,514 for a single adult with no income, so it’s a benefit cut for the poorest dressed up as reform. That’s why Plan C now uses 40.6%. It keeps the floor and still takes less of each extra pound than the 55p taper today. It costs about £38.3bn a year more than it replaces before the levy, against £54.1bn for a 50% NIT.
Where it goes wrong is the help that stays. If rent and child support still come off at 55p on top of a 40% or 50% NIT, the two add up and the trap gets worse. It's like two different people each taking a cut of the same pay rise. A NIT only works if it absorbs the rest of UC or the rest tapers off income after the NIT. Friedman made the point himself in 1962: it should replace the rag bag of measures, not join it.
What the experiments found
What happens when you actually try it on real families? America tested this between 1968 and 1982. The Seattle and Denver experiments had tax rates around 50%. Husbands cut their hours by about 9%, wives by about 20% and single mothers by about 25% (Robins and West).
Gary Burtless worked out that about a third of the net cost went on making up for lower earnings, though some of the fall was people under-reporting income. That’s why I add 15% to the cost in the central case and a third in the high case.
The verdict
Of the three, Plan C is the one I’d take. Plan A funds itself but does nothing for the middle. Plan B needs cuts on a scale nobody in Westminster is talking about.
Plan A, Flat 20. A land tax at about 70% of land rent pays for scrapping stamp duty, business rates and council tax, cutting CGT to 5% and flattening income tax to 20%. Debt reaches about £80bn by year 10 and it’s still rising. It balances at 21% before growth effects and about 20% with them. Someone on £30,000 gets nothing.
Plan B, Flat 10. It needs £80bn to £135bn a year of cuts by year 10 in today’s money, 2.1% to 3.7% of GDP, even with the land tax at 85% of rent. That’s about three times the Tory welfare plan.
Plan C, Flat 15. 15% over a £14,000 allowance, a 40.6% NIT that keeps the £5,099 floor, a 2% health levy and the land tax at 85% of rent. It needs £58bn of cuts a year by year 10 in today’s money with central growth, £37bn to £84bn across the range. The debt stops at £54bn from year 3. With high rates it’s £58bn of cuts and £55bn of debt, so rates matter less than growth here.
The NIT. At 20% it roughly pays for itself but lowers the floor for the poorest. At 40.6% it keeps the floor. That’s what Plan C now does and the health levy pays for most of the extra. At 50% it pays more than the floor and adds about £54.1bn a year, which breaks Plan A unless the flat rate goes up to about 24%. I’d only go higher if it replaced the rest of UC as well.
What the NIT does to the plans
| Central growth, base rates | Debt year 3 | Debt year 5 | Debt year 10 | Gap year 10 | Cut year 10 |
|---|---|---|---|---|---|
| Plan A | £53.6bn | £60.2bn | £80.5bn | None | No cuts |
| Plan A + NIT 20% | £53.6bn | £60.2bn | £84.8bn | £4bn | No cuts |
| Plan A + NIT 50% | £53.6bn | £60.2bn | £208.8bn | £76bn | No cuts |
| Plan B | £53.6bn | £60.2bn | £80.5bn | None | £129bn |
| Plan B + NIT 50% | £53.6bn | £60.2bn | £80.5bn | None | £206bn |
| Plan C with a 20% NIT and no levy | £53.6bn | £53.6bn | £53.6bn | None | £55bn |
| Plan C, NIT 40.6% and levy built in | £53.6bn | £53.6bn | £53.6bn | None | £71bn |
Cash terms. The NIT comes in with the income tax cuts from year 5. Plan A with a 20% NIT balances at 70% of land rent with a 20.2% flat rate. With a 50% NIT it needs 23.8%.
My call. If I were advising a chancellor I’d take Plan C and keep NI for now. Flat 10 is a great line on X. Flat 15 with a land tax underneath is a plan.
Every number on these pages comes from FINK's illustrative model on OBR, HMRC, ONS, DWP, ATO and LaingBuisson data, with my assumptions labelled on the plan assumptions section.
The benefit nobody counts
When people talk about the benefits bill they mean cash. The biggest benefit most households get is the NHS and it isn’t in that number. Have you ever thought of your GP appointment as a benefit?
The ONS puts a value on the NHS care each household uses, based on who lives there. In 2023-24 it was £7,607 a year for the average household. That’s nearly as much as every cash benefit put together, state pension included. The government spent £280bn on healthcare in 2025, about £4,030 for every person in the UK (ONS, my sum).
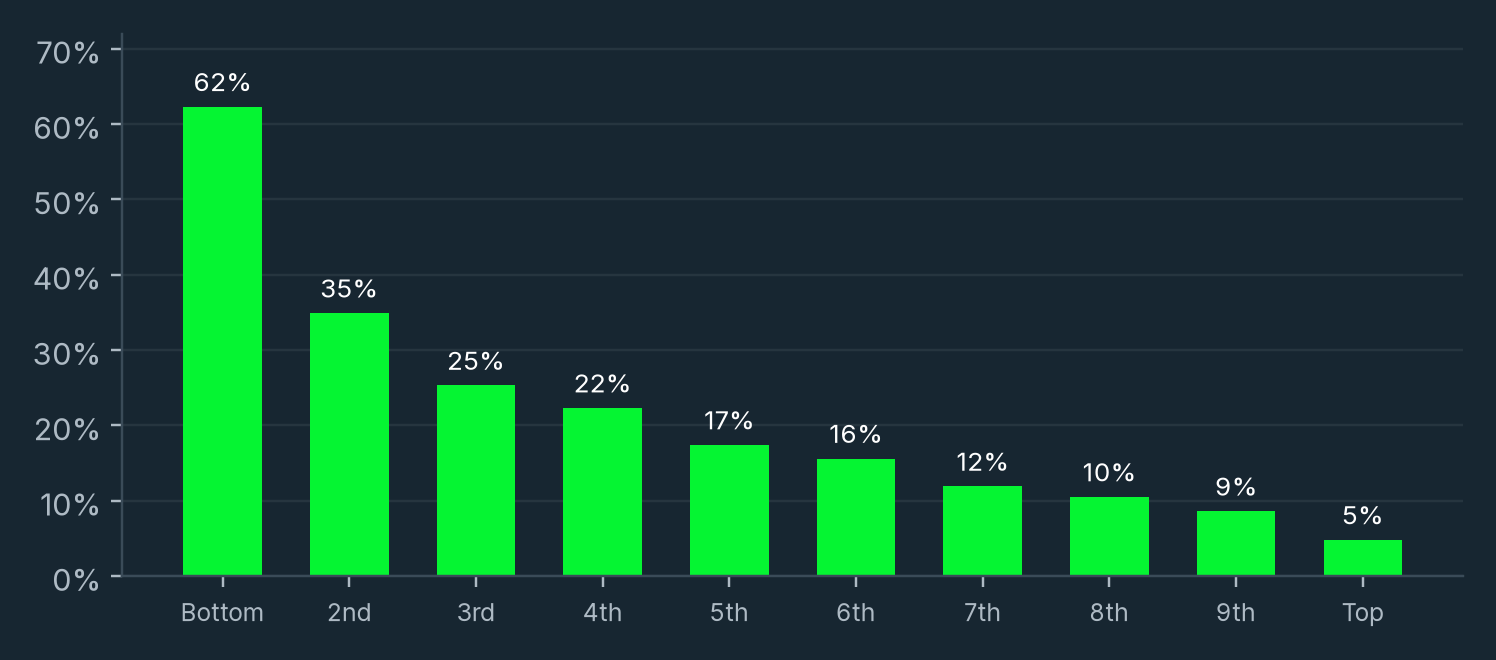
Households in the poorest tenth get £8,911 of NHS care a year, worth 62% on top of a disposable income of £14,298. The richest tenth get £6,104, under 5% of theirs. Both get care worth a similar amount, but only one of them pays most of the bill. It’s one of the biggest transfers in the whole system.
How it hides the real size of the transfer
Welfare is 11.1% of GDP this year (OBR). Government healthcare was another 9.3% of GDP in 2025 (ONS, my sum) and none of it counts as welfare. Once the NHS and schools are in, 53.3% of people live in households that get more in benefits than they pay in tax (ONS, 2023-24).
I’m not saying that’s wrong. Most of it’s people getting older and the NHS doing its job. But it’s paid for by income tax and NI, so if you cut income tax as hard as Plan B does, the NHS is what you’re really arguing about. And because it’s free when you use it nobody sees a price, so nobody asks if it’s good value. It’s like a restaurant with no prices on the menu. How would you ever know if the meal was worth it?
How Australia does it
Australia has universal public healthcare like us. The difference is it pushes people who can afford it into private insurance and uses the tax system to do it.
Medicare levy. 2% of taxable income on top of income tax, which helps pay for Medicare, the public system. Low earners pay less or nothing (ATO).
Medicare Levy Surcharge. 1%, 1.25% or 1.5% more for singles over A$101,000, or families over A$202,000, who don’t have private hospital cover (ATO, 2025-26).
Insurance rebate. The government pays 24.118% of the premium for under 65s on the base tier, more for over 65s and nothing for singles above A$158,000 (privatehealth.gov.au, from April 2026). It costs about A$7.9bn this year (Guardian).
Lifetime Health Cover. Take out hospital cover after the 1 July following your 31st birthday and you pay 2% more for every year over 30, up to 70%. It drops off after 10 years of continuous cover (privatehealth.gov.au). Think of it as a late joiner’s fee at a club.
The public and private mix
45.8% of Australians had private hospital cover in June 2026 (APRA). In 2024-25, 40% of hospital stays were in private hospitals and 60% in public ones (AIHW). Here 4.92m people pay for private medical cover, about 7% of the population (LaingBuisson, my sum).
The stick worked better than the carrot. Butler (2002) found the jump in cover after 2000 was largely down to Lifetime Health Cover, which cost the government virtually nothing. The rebate came first, so its cost went up because more people joined, not the other way round. In June 2026, 1.2m Australians were paying the loading (APRA).
Worth knowing. It’s still universal. Everyone gets Medicare and public hospitals are free. Private cover buys choice of doctor and shorter waits for planned surgery. It doesn’t buy you out of the levy.
Is it any better?
On spend and outcomes, yes. On waiting, not really.
| Measure | Australia | UK | Source |
|---|---|---|---|
| Health spending, % of GDP, 2024 | 10.3% | 11.1% | OECD |
| Spending per person, US$ PPP, 2024 | $7,469 | $6,747 | OECD |
| Life expectancy at birth, 2023 | 83.0 years | 81.0 years | OECD |
| Avoidable deaths per 100,000, 2023 | 146 | 227 | OECD |
| Happy with the availability of good care, 2024 | 71% | 61% | OECD |
| Median wait for a hip replacement, 2024 | 130 days | 116 days | OECD |
| Commonwealth Fund rank, overall, 2024 | 1st of 10 | 3rd of 10 | Commonwealth Fund |
| Commonwealth Fund rank, access to care | 9th of 10 | 2nd of 10 | Commonwealth Fund |
OECD, Health at a Glance 2025 and OECD Health Statistics. The OECD warns waiting times aren’t measured the same way in every country. Commonwealth Fund, Mirror, Mirror 2024.
Australia spends less of its GDP, lives two years longer and has far fewer avoidable deaths. Wealth, diet and sunshine explain some of that, not just the system. But the money goes further.
It isn’t better on waits. Public patients wait a long time there too. The median wait for public planned surgery was 45 days in 2024-25 and 6.0% waited more than a year (AIHW). Here 7.4m treatment pathways were waiting at the end of September, 65.8% within 18 weeks against a 92% standard (NHS England). They’re counted differently, so I wouldn’t line them up.
The Commonwealth Fund ranked Australia first overall in 2024 and the UK third. Australia came ninth of ten on access, partly because people without private cover can wait longer. The UK came top on affordability.
A UK version, now part of Plan C
This is part of Plan C, because it’s what pays to keep the benefit floor. Half the inputs are my assumptions, so I show the range.
| Piece | Design | Money a year, 2026-27 |
|---|---|---|
| Health levy | 2% on income over the Plan C allowance of £14,000 | Raises £26.6bn |
| Insurance rebate | 24% of private hospital premiums for people under an income limit | Costs £1.9bn on today’s 4.92m subscribers, £3.8bn at 10m, £5.7bn at 15m |
| Opt-out surcharge | 1.25% for people over £100,000 without hospital cover | £0.6bn to £2.9bn, depending how many buy cover instead |
| Lifetime cover loading | 2% on premiums for every year over 30 you wait, up to 70% | Costs nothing |
| Net | All four together | £21.4bn to £27.6bn now, £25bn to £32bn by year 10 in today’s money |
What it does to Plan C
| Uptake case | People with cover | Net now | Net year 10, today’s money | Plan C cut year 10, today’s money |
|---|---|---|---|---|
| No levy | £84bn | |||
| Low uptake | 4.92m, today | £27.6bn | £32bn | £54bn |
| Central (Plan C) | 10m | £24.5bn | £29bn | £58bn |
| High uptake | 15m | £21.4bn | £25bn | £61bn |
Plan C with its 40.6% NIT, base rates, central growth effects. The levy, rebate and surcharge phase in with the income tax cuts from year 5. FINK's illustrative model.
Levy base £1,262bn of income over £14,000 (HMRC Table 2.5), scaled to OBR receipts. Premium £1,582 per subscriber (LaingBuisson). Rebate rate from privatehealth.gov.au. 2.06m taxpayers over £100,000 with £460bn of income (HMRC). Subscriber numbers and how many high earners stay uninsured are my assumptions. NHS savings from people going private aren’t counted. FINK's illustrative sums.
With 10m people insured the levy brings in a net £24.5bn at today’s incomes and £29bn by year 10 in today’s money. That’s what lets Plan C keep the £5,099 floor. Without it the year 10 cut would be £84bn. With it the cut is £58bn, or £54bn to £61bn depending how many people buy cover. More cover means a bigger rebate bill, so the cut goes up.
But be honest about what the levy is. A 2% levy on a 15% flat tax is a 17% flat tax with a label on it. The label is the point. Remember the restaurant with no prices? This puts the price on the menu, so you’d see what health costs on your payslip.
Why I’d move towards it
My view is Britain should move closer to Australia’s system. Keep the NHS universal and free for anyone who needs it. Get people who can afford it to insure for planned hospital work, so NHS money goes further for everyone else. Do the stick first, because that’s what worked there.
The risks
The first risk is two tiers, where people who pay get seen sooner. People without cover in Australia still wait longer. The rebate is expensive and hard to take back. Australia’s government tried to trim the extra rebate for over 65s this year and the Senate threw the bill out in October (Guardian).
Private cover also needs private hospitals and consultants. If the same consultants split their week, NHS queues might not get any shorter. And it won’t shrink the cost of an ageing population. It moves some of it from the taxpayer to the household.
Where the money could go
Britain keeps its wealth in land. A land tax makes land a worse place to keep it, so some of that money moves. This is how much might move and what it could do for the London market.
Households in the UK are worth £10.8tn after debts. Land makes up £4.5tn and the homes built on it £2.1tn (ONS, June 2026). Their financial assets come to £6.8tn (ONS, 2025). Only 13.1% sits in shares held directly against 43.7% in the US. 34.7% is in cash against 10.4% (OECD).
Today land is the best tax shelter in the country. Your main home pays no CGT, prices have outrun pay for decades and council tax in England still uses 1991 values. Plan C turns that round. The land pays every year and gains on shares are taxed at 5%. In the model land values fall about 83% by year 10, from £6.9tn to £1.2tn in cash terms. So where would you keep your money if your house paid tax every year and your shares barely did? Money that would have gone into bigger deposits, bigger mortgages and buy to let has to go somewhere else.
Three scenarios
| Over 10 years, today’s money | Low | Central | High |
|---|---|---|---|
| Share of the UK and US gap in direct shares that closes | 5% | 15% | 30% |
| Share of new household share buying that stays in the UK | 25% | A third | 45% |
| Rise in pension money in UK shares | 25% | 50% | 100% |
| Households into shares, all markets | £104bn | £312bn | £624bn |
| Households into UK shares | £26bn | £103bn | £281bn |
| Pensions into UK shares | £33bn | £66bn | £132bn |
| New demand for UK shares | £59bn | £169bn | £413bn |
| A year | £5.9bn | £16.9bn | £41.3bn |
| As a share of the UK market | 2.3% | 6.7% | 16.3% |
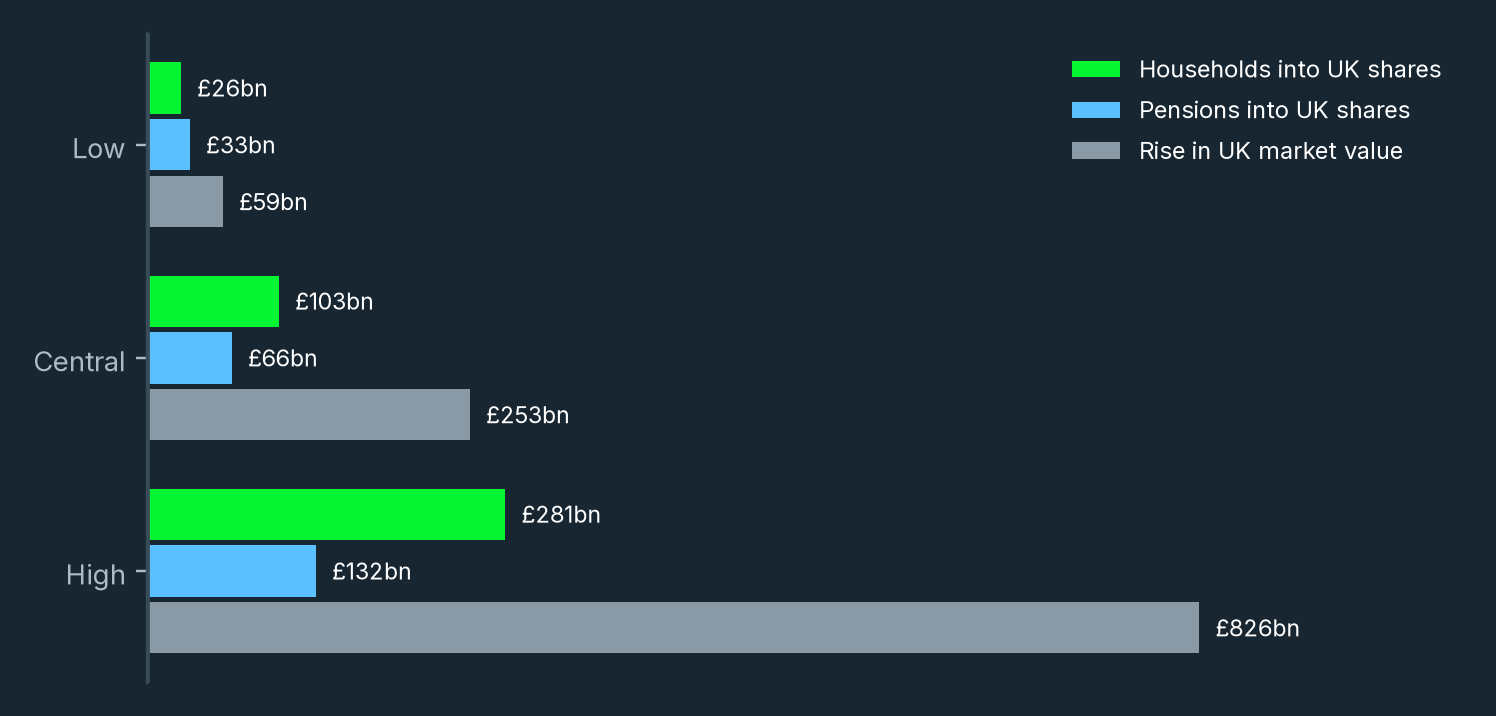
The gap is 30.6 points of £6.8tn of financial assets, about £2.1tn. The central home share of a third is what individuals hold in UK quoted shares, £295bn (ONS, 2024), against their £890bn of shares held directly. That compares listed UK shares with listed and unlisted shares everywhere, so it’s rough. Pensions start from £132bn, 4.4% of £3tn (New Financial, PPI). New Financial says UK pensions could put 50% to 100% more into UK shares and still sit inside international and historical norms. Every scenario percentage is my assumption.
In the central case households put £312bn more into shares over 10 years and £103bn of it stays in Britain. Pensions add £66bn. That’s £169bn of new demand, about £17bn a year or 6.7% of the market. Their cash share would fall from 34.7% to 30.1%, so it’s still nowhere near American.
What it could do for London
New money doesn’t just buy shares. It changes what the shares are worth and that changes who wants to list here.
The valuation discount
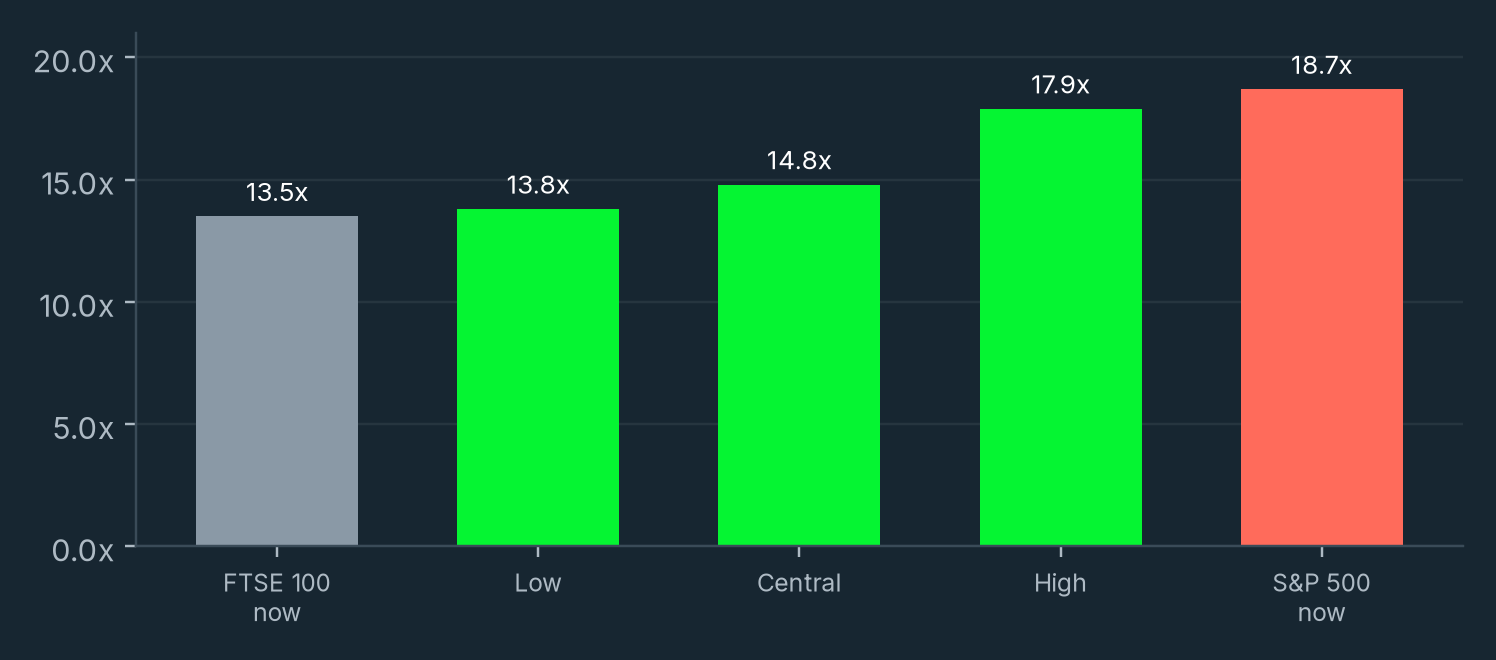
The FTSE 100 trades on 13.5 times next year’s earnings (AJ Bell, Q3 2026). The S&P 500 is on 18.7 times (FactSet, 30 October 2026). That’s a discount of 28%.
How far prices move depends on how much each pound of buying pushes them. Think of an auction room where one extra keen bidder lifts the price for every lot. Gabaix and Koijen estimate that in the US each $1 of net buying lifts the market’s value by about $5. I use £1 to £2 because 58.8% of UK shares are owned overseas (ONS) and foreign owners can sell into a rally. That’s my assumption.
| Low | Central | High | |
|---|---|---|---|
| Price impact per £1 of buying | £1 | £1.50 | £2 |
| Rise in UK market value | £59bn | £253bn | £826bn |
| Rerating | 2% | 10% | 32% |
| FTSE 100 forward multiple | 13.8x | 14.8x | 17.9x |
| Discount to the US | 26% | 21% | 4% |
The central case lifts UK shares about 10% and cuts the discount to 21%. The high case gets it down to 4%. Some of the gap may never close. London is heavy in banks, oil and miners and light in tech. A land tax doesn’t change that.
Listings and delistings
88 companies left the Main Market or moved their primary listing in 2024, the most since 2009, while 18 listed and raised £778m (EY). 2025 was better with 23 IPOs raising £2.1bn (EY). Ashtead moved its primary listing to New York as Sunbelt Rentals in March 2026 (SEC).
Say you run a growing British company and your bankers tell you the shares would be worth more in New York. What would you do? The reasons companies give are a deeper pool of investors, more trading in their shares and higher valuations (EY).
If 10% to 30% of the new demand went into fresh shares, that’s £0.6bn, £3.4bn or £12.4bn a year of new equity, IPOs and follow-on raises together. Against £2.1bn of IPO money in 2025, the central case is about 1.6 times that and the high case about 6 times. The split is my assumption.
Pensions
UK pension funds had over half their money in UK shares 25 years ago. Now it’s 4.4% against a 10.1% average for other countries at home (New Financial). Pension funds own 1.6% of UK quoted shares, down from 32.4% in 1992 (ONS). The Mansion House Accord has 17 workplace pension providers aiming for 10% in private markets by 2030, with at least half of that in the UK (Pensions UK). That’s private markets, not the stock market.
Business investment
UK firms invest 11.1% of GDP (IPPR). The Capital Markets Industry Taskforce reckons the UK needs about £100bn a year more productive investment for ten years (LSEG evidence to Parliament). Even the high case raises £12bn a year, about 12% of that. The bigger effect is the price. A higher share price makes new money cheaper for every listed company, not just the ones raising it.
What could go wrong
None of this is automatic. Three things could stop it or make it hurt.
The money goes abroad
Plan C cuts the tax on every share, not just British ones. Most new money could end up in a global tracker that’s about two thirds American. Even the high case sends £343bn of household money overseas. That’s good for the saver and does nothing for London. New Financial puts Australia’s high home allocation down to tax incentives. A land tax opens the door and the ISA and pension rules decide which way the money walks.
House prices and the banks
Banks and building societies hold £1,761bn of residential mortgages (Bank of England, Q2 2026). That’s about 27% of what household land and homes are worth. If land fell as far as the model has it and buildings kept their value, it would be about 61%. In Q2 2026, 8.4% of new mortgages were above 90% of the home’s value, the highest share since 2008 (Bank of England). Those buyers would be first into negative equity.
Say you’re a young couple who stretched for a first flat with a small deposit. If the land under it lost value faster than you paid the mortgage down, you’d owe more than the flat is worth.
That’s the biggest risk in the whole report. Falling collateral means banks lend less and hold more capital. Smaller mortgages also mean smaller bank balance sheets. The ten year phasing is there for this. Think of the difference between walking down the stairs and jumping off the landing. Prices that fall slowly while pay rises are survivable. A crash isn’t.
The transition
Markets price news early. In the model land prices fall in steps as each phase starts, not smoothly. People near retirement with their wealth in a house would feel it before they see the tax cuts. Some households would pay off mortgages or spend instead of buying shares. That’s one reason the low case is small.
My view
A land tax would do more for the London market than any listing rule change, because it goes after the reason British money sits in bricks. But whether the money stays in Britain depends on pensions and ISAs.
All the numbers in this section are FINK’s illustrative sums on ONS, OECD, Bank of England, EY, AJ Bell, FactSet and New Financial data. Scenario inputs are my assumptions, shown in the tables.
What it means for your money
I don't think any government does this soon. In Fix the UK my call was years of drift and then the Bank of England capping gilt yields. I still think that.
So who wins if it ever did happen? The winners would be people who work for a living and own businesses. The losers would be people whose wealth is mostly land, especially land that isn't doing much.
Shares would get more attractive next to property, because gains would be taxed less while land paid every year. That's the opposite of how Britain works today. Until then the system is what it is, so you use the ISA and SIPP you've got and have a process for what you own and when you'd sell it.
Reply to the post on X and tell me why I'm wrong.
Model assumptions
FINK's illustrative model, not an official forecast. Sourced figures are named. Everything else is my assumption and labelled that way.
| Item | Value | Source |
|---|---|---|
| Receipts 2026-27 | Stamp duty £16.5bn, business rates £35.1bn, council tax £54.0bn, CGT £25.6bn, income tax £365.4bn including dividend tax, NI £214.2bn | OBR EFO Oct 2026, Table A.5 |
| Land value | £6.9tn for 2025, used as the 2026-27 start | ONS national balance sheet 2026. Timing is an FINK assumption |
| Nominal GDP | 3.6, 3.5, 3.7, 3.8, 3.7, 3.5% from 2026-27 to 2031-32, then 3.5% | OBR EFO Table A.3. Hold is an FINK assumption |
| CPI | 3.3, 3.1, 2.0, 2.1, 2.0, 2.0%, then 2.0% | OBR EFO Table A.3. Hold is an FINK assumption |
| Gilt rate | 5.1, 5.4, 5.6, 5.7, 5.9, 6.0%, then 6.0%. Also the bridge borrowing rate | OBR EFO Table A.3. Hold is an FINK assumption |
| Bank Rate | 4% now, OBR path 3.9% to 4.8%. Not used in the maths | Bank of England, OBR EFO Table A.3 |
| Tax bases | Every receipt grows with nominal GDP | FINK assumption |
| Land rent | 4% of land value in 2026-27, £276bn, growing with nominal GDP | FINK assumption. No published UK figure |
| Land price | Rent over (gilt rate plus 2.5 point premium, less rent growth, plus land tax rate) | FINK assumption. Premium set to match the 4% start. Mirrlees ch.16 on capitalisation |
| Policy | Stamp duty and business rates go in year 1, business land levy equal to business rates in years 1 to 3. Council tax goes in year 4, CGT in years 7 and 8. Income tax and NI cut 5% in year 9 and 10% in year 10 | FINK assumption. Illustrative plan |
| Land tax rate | Set once to cover the taxes removed from year 4 in the base case: 3.0%, 3.1%, 3.1%, 3.8%, 4.6%, 7.0%, 10.9% | FINK assumption, solved in the model |
| Scenarios | High rates: gilts +1.5 points, CPI and nominal growth +1 point. Low rates: gilts 1.5 points lower | FINK assumption |
| Growth case | 10p of every £1 of income tax, NI and CGT cut comes back | FINK assumption. Not a sourced elasticity |
| Deferral case | 10% of the land tax deferred until sale, rolled up at the gilt rate | FINK assumption |
| Bridge | Shortfalls borrowed at the gilt rate, interest added each year | FINK assumption |
Flat tax plan assumptions
Inputs for section 07. Low, central and high growth cases use the values in that order. Sourced figures are named and everything else is labelled as my assumption.
| Item | Value | Source |
|---|---|---|
| Plan A | 20% flat income tax on all income over a £12,570 allowance for everyone, NI kept, CGT 5%, land tax up to 70% of land rent | FINK's illustrative plan |
| Plan B | 10% flat income tax, same allowance, NI kept, CGT 5%, land tax up to 85% of land rent, spending cut to close any gap from year 4 | FINK's illustrative plan |
| Plan C | 15% flat income tax over a £14,000 allowance, NI kept, CGT 5%, a 40.6% NIT in place of the UC standard allowance so the floor stays at £5,099, a 2% health levy over the allowance with an insurance rebate and an opt-out surcharge, land tax up to 85% of land rent. Cuts from year 4 cover the gap and the bridge interest | FINK's illustrative plan, v5 (14 Nov 2026) |
| Health levy | 2% of income over £14,000, raising £26.6bn in 2026-27. Rebate of 24.118% of a £1,582 premium. Surcharge of 1.25% of income for people over £100,000 without cover. Central case 10m private subscribers and 30% of high earners uninsured, low and high uptake cases 4.92m and 15m. Phased in with the income tax cuts and grown with nominal GDP | ATO, privatehealth.gov.au, LaingBuisson, HMRC Table 2.5. Uptake is a FINK assumption. NHS savings not counted |
| Phasing | Property swap as in the core model. Income tax and CGT step down evenly in years 5 to 10 | FINK assumption |
| Flat tax base | £1,320bn of income over £12,570 (A and B), £1,262bn over £14,000 (C), scaled by 1.053 to OBR receipts. Full allowance for everyone, incomes spread evenly inside the HMRC band where the allowance falls | HMRC Income Tax liabilities statistics, Jul 2026, Table 2.5. Scaling and spread are FINK assumptions. v3 tapered the allowance above £100,000 |
| CGT | £116bn of gains (OBR £25.6bn at a 22% average rate). Realisation elasticity 3.6 in the growth cases | OBR CGT supplementary release, Jan 2025. 22% is a FINK assumption |
| Investment channel | Business rates on buildings and machinery (30%, 50%, 60% of £35.1bn) over £517.7bn of company operating surplus gives the cut in the cost of capital. Lower capital taxes add 0%, 0.5% or 1% (Plan A), 0%, 0.75% or 1.5% (Plan C) and 0%, 1% or 2% (Plan B) | ONS series CAER 2025. Shares are FINK assumptions |
| Investment response | User cost elasticity 0.25, 0.4 or 0.7. A 2.4% cut in the cost of capital adds 0.2% to GDP in the long run, half within 5 years | OBR, The economic effects of full expensing, Feb 2024 (0.4, range 0.25 to 1) |
| Labour channel | Hours rise by 0.05, 0.10 or 0.20 times the change in log take-home per extra £1, weighted by income for output and by taxpayers for hours. Two thirds of extra labour shows up in output. 45% of the remaining response comes each year. 31.3m full-time equivalents | OBR NICs costings (2p cut, 0.3% more hours, 94,000 FTE). HMRC Table 2.5. Timing is an FINK assumption, SIME/DIME took 2.4 to 4.5 years |
| Tax on extra GDP | 37.2% of GDP less the taxes removed. Land rent rises with GDP | OBR EFO Oct 2026 Table A.9 |
| NIT | Paid at 20%, 40.6% (Plan C) or 50% of the gap between own income and £12,570, per adult aged 16 to 64, phased in with the income tax cuts. 40.6% gives a £5,099 floor, the UC standard allowance for a single adult aged 25 or over | FINK's illustrative design after Friedman (1962). gov.uk UC rates 2026-27 |
| NIT population | 10.77m not in work, 3.23m employees under £12,570, 1.53m part-time self-employed. Average own income £1,500, £7,500 and £6,000 | ONS A01 Jun-Aug 2026 and ASHE 2026 Table 1.7a. Incomes are FINK assumptions |
| NIT replaces | UC standard allowance £28.8bn, UC transitional element £0.9bn, legacy income-based JSA, ESA and Income Support £0.04bn. Housing, child, health, carer and childcare help and pensions are kept | DWP Benefit expenditure and caseload tables, Spring Forecast 2026, 2026-27 |
| NIT work response | Adds nothing, 15% or a third to the gross cost | Burtless (1986): about a third of the SIME/DIME net cost came from lower earnings |
| Take-home | Employee in England, Wales or Northern Ireland, category A NI, earnings only, no pension or loan deductions. Plan C includes the 2% health levy and, where marked, the 1.25% surcharge for an uninsured earner over £100,000 | gov.uk income tax and NI rates 2026-27 |
How the numbers were worked out
Tax receipts are the OBR's 2026-27 forecast from the Economic and fiscal outlook, October 2026, Table A.5. Property taxes means council tax (£54.0bn), business rates (£35.1bn) and property transaction taxes (£16.5bn, mostly stamp duty land tax). Taxes on income and capital means income tax (£365.4bn, which includes dividend tax), National Insurance (£214.2bn) and capital gains tax (£25.6bn).
Land value is the ONS's preliminary estimate of UK non-produced assets for 2025, £6.9 trillion, which the ONS defines as land (June 2026). It's a market value and will be revised.
Land tax yields are FINK calculations: rate times £6.9tn. They're static, so they ignore the fall in land prices a land tax would cause. They also overstate what could be collected at higher rates.
Transition sums and the model on the sections from ten years, four phases to bridging the gap are FINK's illustrative work, not an official forecast. They assume land earns 4% of its value a year in rent, which is FINK's assumption, not a published figure. Every model assumption is listed on the model assumptions section.
Quotes were checked against the original texts or published interviews listed on the next page. The Ricardo line is shortened with an ellipsis where the original has a semicolon. Aquinas is included with the caveat on the what they said section.
Sources
Every link below was opened and checked on 14 November 2026. Where a site blocks automated checks I opened it in a browser.
Quotes
- Thomas Aquinas, Summa Theologiae, II-II, Q.66, A.2 (Fathers of the English Dominican Province translation): newadvent.org/summa/3066.htm
- Adam Smith, An Inquiry into the Nature and Causes of the Wealth of Nations, 1776, Book V, ch.2, Part II, Article I: gutenberg.org/ebooks/3300
- Thomas Paine, Agrarian Justice, 1797, in The Writings of Thomas Paine, Vol. III: gutenberg.org/ebooks/31271
- David Ricardo, On the Principles of Political Economy and Taxation, chapter Taxes on Rent: gutenberg.org/ebooks/33310
- John Stuart Mill, Principles of Political Economy, 1848, Book V, ch.2, s.5 (Laughlin abridged edition): gutenberg.org/ebooks/30107
- Henry George, Progress and Poverty, 1879, Book VIII, ch.2: gutenberg.org/ebooks/55308
- Leo Tolstoy, A Great Iniquity, The Times, 1 August 1905, section IV: en.wikisource.org/wiki/A_Great_Iniquity
- Winston Churchill, speech at King's Theatre, Edinburgh, 17 July 1909, in Liberalism and the Social Problem, 1909: gutenberg.org/ebooks/18419. Also quoted in IFS Tax by Design ch.16
- UK Parliament, New directions, new taxes (People's Budget, land taxes and the Lords): parliament.uk. War and the coming of income tax (1799): parliament.uk
- Milton Friedman, interview, Human Events 38(46), 18 Nov 1978, reprinted in The Times Herald, Norristown, 1 Dec 1978: cooperative-individualism.org
- IFS, Tax by Design: the Mirrlees Review, 2011, ch.16 (pp.373 to 378 and 404 to 405): ifs.org.uk/books/tax-design
- Martin Wolf, The case for a land value tax is overwhelming, Financial Times, 5 Feb 2023: ft.com
UK tax, land and housing
- OBR, Economic and fiscal outlook, October 2026, Table A.5 (receipts) and tax and welfare figures: obr.uk
- ONS, The national balance sheet and capital stocks, preliminary estimates, UK: 2026 (non-produced assets £6.9tn, 2025): ons.gov.uk
- ONS, Housing affordability in England and Wales: 2025, 26 Mar 2026: ons.gov.uk
- gov.uk, Council Tax bands (1 April 1991 values in England): gov.uk/council-tax-bands. Income tax rates: gov.uk/income-tax-rates
- Hilber and Lyytikäinen, Transfer taxes and household mobility, Journal of Urban Economics 101, 2017: researchonline.lse.ac.uk
- CMA, Housebuilding market study final report, Feb 2024: gov.uk (PDF)
- Zoopla, Just one in ten first-time buyers pay stamp duty in the North, compared to eight in ten in London: zoopla.co.uk
- OECD, household financial assets by instrument (cash and deposits, shares): data-explorer.oecd.org
- Bank of England, Bank Rate (4%, 5 Nov 2026): bankofengland.co.uk. UK DMO, gilt auction results: dmo.gov.uk
- FINK, Fix the UK report (Britain has three ways out of this mess), Nov 2026 edition
Land value tax in practice
- Estonian Tax and Customs Board, Land tax (2026 rate bands, homeowner incentive): emta.ee
- Enough Berlin, Estonia's Land Value Tax: Good, But Underpowered, 22 Mar 2026 (since 1993, valuations 2001 and 2022): enough.berlin
- Danish Property Valuation Agency (Vurderingsstyrelsen), Grundskyld: vurderingsportalen.dk
- Center for Land Economics, Land value tax in Pennsylvania (updated 29 Oct 2026): landeconomics.org
- Zhou Yang, The Effects of the Two-Rate Property Tax: What Can We Learn from the Pennsylvania Experience?, Lincoln Institute of Land Policy WP14ZY1, 2014: lincolninst.edu (PDF)
- Liberal Democrats, For a Fair Deal, manifesto 2024 (Commercial Landowner Levy): libdems.org.uk (PDF)
- Green Party, Real Change, manifesto 2024 (land value tax as long-term aim): greenparty.org.uk (PDF)
- Fairer Share, Proportional Property Tax: fairershare.org.uk
Getting there
- IFS, Tax by Design: the Mirrlees Review, 2011, ch.16 (land tax capitalisation, stamp duty swap, business land first): ifs.org.uk/books/tax-design
- OBR, Economic and fiscal outlook, October 2026, Table A.3 (nominal GDP, CPI, Bank Rate and gilt rate paths used in the model): obr.uk
- OBR, Economic and fiscal outlook, October 2026 (debt interest £124bn in 2026-27, £16bn per point on interest rates): obr.uk
- gov.uk, Budget 2025: Retail, hospitality and leisure factsheet (3-yearly revaluations, April 2026 list, £4.3bn support): gov.uk
- gov.uk, Business rates relief: Transitional relief (2026 to 2029 caps): gov.uk
- Statistics Denmark, Real property taxes: accuracy and reliability (valuations frozen 2013 to 2023): dst.dk
- Vurderingsstyrelsen, Nu får de første boligejere deres ejendomsvurdering, 21 Oct 2021 (grundskyld rises can be frozen until the owner moves): vurdst.dk
- WalesOnline, Huge changes to council tax in Wales shelved by Plaid Cymru, 20 Oct 2026: walesonline.co.uk
- California State Controller, Property Tax Postponement: sco.ca.gov
- OECD, Tax Policy Reform and Economic Growth, 2010 (tax and growth ranking): oecd.org
Two flat tax plans
- HMRC, Income Tax liabilities statistics, collated tables 2.1 to 2.6, July 2026 (2026-27 projections): gov.uk (ODS)
- HMRC, Capital Gains Tax statistics commentary: gov.uk. OBR, Costing of changes to the main, BADR and IR rates of CGT, Jan 2025 (retention elasticity 3.6): obr.uk (PDF)
- gov.uk, National Insurance rates 2026-27: gov.uk. Income tax rates: gov.uk/income-tax-rates
- OBR, Economic and fiscal outlook, October 2026 (Table A.7 spending, Table A.9 taxes 37.2% of GDP, Table 5.1, Table 5.5 and Box 5.1 on welfare): obr.uk
- OBR, The economic effects of full expensing, Feb 2024 (user cost elasticity 0.4, range 0.25 to 1): obr.uk (PDF)
- OBR, The economic effect of policy measures, Nov 2023 (full expensing about 0.2% of GDP long run, NICs cut 94,000 FTE): obr.uk. The labour supply impacts of personal tax policies, Mar 2024: obr.uk
- Barnes, Price and Sebastia-Barriel, The elasticity of substitution: evidence from a UK firm-level data set, Bank of England WP 348, 2008: bankofengland.co.uk (PDF)
- IPPR, UK business investment second lowest in G7 (11.1% of GDP): ippr.org
- ONS, Private non-financial corporations gross operating surplus, series CAER: ons.gov.uk
A negative income tax
- Milton Friedman, Capitalism and Freedom, 1962, ch.12, p.192, as quoted in Luther, Why Is There No Milton Friedman Today?, Journal of Private Enterprise 39(1), 2024: journal.apee.org (PDF)
- DWP, Benefit expenditure and caseload tables 2026, Spring Forecast (UC elements 2026-27): gov.uk
- gov.uk, Universal Credit, What you'll get: gov.uk. How your wages affect your payments (55p taper): gov.uk
- ONS, Summary of labour market statistics A01, 20 Oct 2026: ons.gov.uk. ASHE Table 1, 2026 provisional: ons.gov.uk
- Robins and West, Labor Supply Response Over Time, Journal of Human Resources, 1980: doi.org/10.2307/145400
- Burtless, The Work Response to a Guaranteed Income, Federal Reserve Bank of Boston, 1986: bostonfed.org (PDF). IRP discussion paper on the Seattle and Denver results: irp.wisc.edu (PDF)
Plan C
- IFS, The Conservatives' plan for welfare: IFS response, Tom Waters, 10 Nov 2026 (£36bn, 21% of £173bn working-age bill in 2029-30): ifs.org.uk
- HMRC, Income Tax liabilities statistics, Table 2.5, 2026-27 (income bands used for the £14,000 allowance and the health levy base): gov.uk (ODS)
The NHS and Australia
- ONS, Effects of taxes and benefits on household income, FYE 2024, reference tables, Table 2b (NHS benefit in kind by decile): ons.gov.uk. Bulletin (53.3% net recipients): ons.gov.uk
- ONS, Healthcare expenditure, UK Health Accounts: 2024 and 2025, 29 Apr 2026 (£280bn government, £345bn total, £4,966 per person, 11.4% of GDP): ons.gov.uk
- OECD, Health at a Glance 2025 (Tables 1.2, 1.4 and 1.6, waiting times): oecd.org. Hip replacement waits from OECD Health Statistics via nz-in-numbers.vercel.app
- Commonwealth Fund, Mirror, Mirror 2024: commonwealthfund.org
- ATO, What is the Medicare levy?: ato.gov.au. Medicare levy surcharge thresholds and rates 2025-26: ato.gov.au
- privatehealth.gov.au, Private Health Insurance Rebate: privatehealth.gov.au. Lifetime Health Cover: privatehealth.gov.au
- APRA, Quarterly private health insurance membership and benefits summary, June 2026: apra.gov.au
- AIHW, Hospitalisations and patient days 2024-25: aihw.gov.au. Elective surgery waiting times 2024-25: aihw.gov.au
- NHS England, RTT waiting times statistical press notice, September 2026: england.nhs.uk (PDF)
- LaingBuisson, Health Cover UK Market Report, 22nd edition, Nov 2026 (£7.79bn, 4.92m subscribers, £1,582 average premium): laingbuisson.com
- The Guardian, What do we know about Labor's controversial private health insurance plans?, 18 Oct 2026 (A$7.9bn rebate cost): theguardian.com
- Butler, Policy change and private health insurance: did the cheapest policy do the trick?, Australian Health Review 25(6), 2002: doi.org/10.1071/ah020033
The London market
- ONS, The national balance sheet and capital stocks, preliminary estimates, UK: 2026 (household net worth £10.8tn, land £4.5tn, dwellings £2.1tn): ons.gov.uk
- ONS, Households and NPISH total financial assets, series NNML (£6,797bn, 2025): ons.gov.uk
- ONS, Ownership of UK quoted shares: 2024 (£2.54tn, individuals 11.6%, overseas 58.8%, pension funds 1.6%): ons.gov.uk
- New Financial, Comparing the asset allocation of global pension systems, Sep 2024: newfinancial.org
- Pensions UK, Pensions and growth, Oct 2024 (PPI estimate of £3tn UK pension assets): pensionsuk.org.uk (PDF). Mansion House Accord: pensionsuk.org.uk
- AJ Bell, dividend report Q3 2026 (FTSE 100 forward multiple): ajbell.co.uk (PDF). FactSet, Earnings Insight, 30 Oct 2026: insight.factset.com
- Gabaix and Koijen, In Search of the Origins of Financial Fluctuations: The Inelastic Markets Hypothesis, NBER working paper 28967: nber.org
- EY, IPO Eye Q4 2024 (88 departures, 18 IPOs, £777.7m): ey.com (PDF). IPO Eye Q4 2025 (23 IPOs, £2.1bn): ey.com
- Sunbelt Rentals Holdings (formerly Ashtead), SEC form 8-K, 2 Mar 2026: sec.gov
- LSEG, written evidence to the Treasury Committee (FRE0055), citing the Capital Markets Industry Taskforce: committees.parliament.uk (PDF)
- Bank of England, Mortgage Lenders and Administrators Statistics 2026 Q2 (£1,760.6bn outstanding, 8.4% above 90% loan to value): bankofengland.co.uk


