

How low is UK investment compared with other countries?
On the measure most reports use, the UK invests less of its income than almost every other big rich economy. The gap is widest in business investment.
The House of Commons Business and Trade Committee said in June 2026 that UK whole-economy investment averaged 17.3% of GDP between 1997 and 2025, the lowest in the G7. It had improved to 19.7% by the final quarter of 2025, which was still second lowest (Investing in the UK economy, paragraph 6). The committee estimated that matching Japan, the G7's top investor, would take £180bn to £200bn of extra investment a year.
Business investment looks worse. IPPR found UK companies invested the equivalent of 11.1% of GDP in 2023, against 12.0% in Germany, 12.7% in France and 18.2% in Japan. Only Canada was lower (IPPR, 1 April 2026).
Those are gross figures. They count every pound spent on new buildings, machines, vehicles, software and research, before allowing for the fact that existing assets are wearing out at the same time. That's the right measure for some questions, like how much demand investment adds to the economy this year. It's the wrong one for a different question: is Britain's stock of productive assets actually growing?
What's the difference between gross and net investment?
Gross investment is spending on fixed assets such as buildings, machines and software, less any sold. Net investment is what's left after you take off depreciation, the value lost as existing assets age, wear out or go out of date.
In the national accounts, gross investment is called gross fixed capital formation (GFCF). Depreciation is called consumption of fixed capital. The ONS defines it as the fall in the current value of fixed assets. It puts that down to "physical deterioration, normal obsolescence, or normal accidental damage" (ONS, Capital stocks and fixed capital consumption, UK: 2025).
Two details matter here.
- It's an estimate, not a cash flow. Nobody writes a cheque for depreciation. The ONS models it from how long each type of asset lasts. That's why its figures get revised when its assumptions change.
- Asset lives vary hugely. The ONS gives homes a weighted life of 50 years and software five years. A pound spent on software has to be replaced about ten times as often as a pound spent on housing.
Net investment is the closest the national accounts get to the question "are we adding to the pile or just topping it up?" The ONS makes the same point about output. Net domestic product takes depreciation off GDP. The ONS calls it "more appropriate from a welfare and sustainability perspective". That's because it's "a proxy of the level of spending that can be maintained while leaving capital assets intact" (ONS, National accounts at a glance).
What does UK net investment look like since 1997?
Gross investment has stayed in a band of about 16% to 19% of GDP since 1997. Net investment peaked at 5.5% in 2007, fell to 2.0% in 2011 and was 4.0% in 2024.
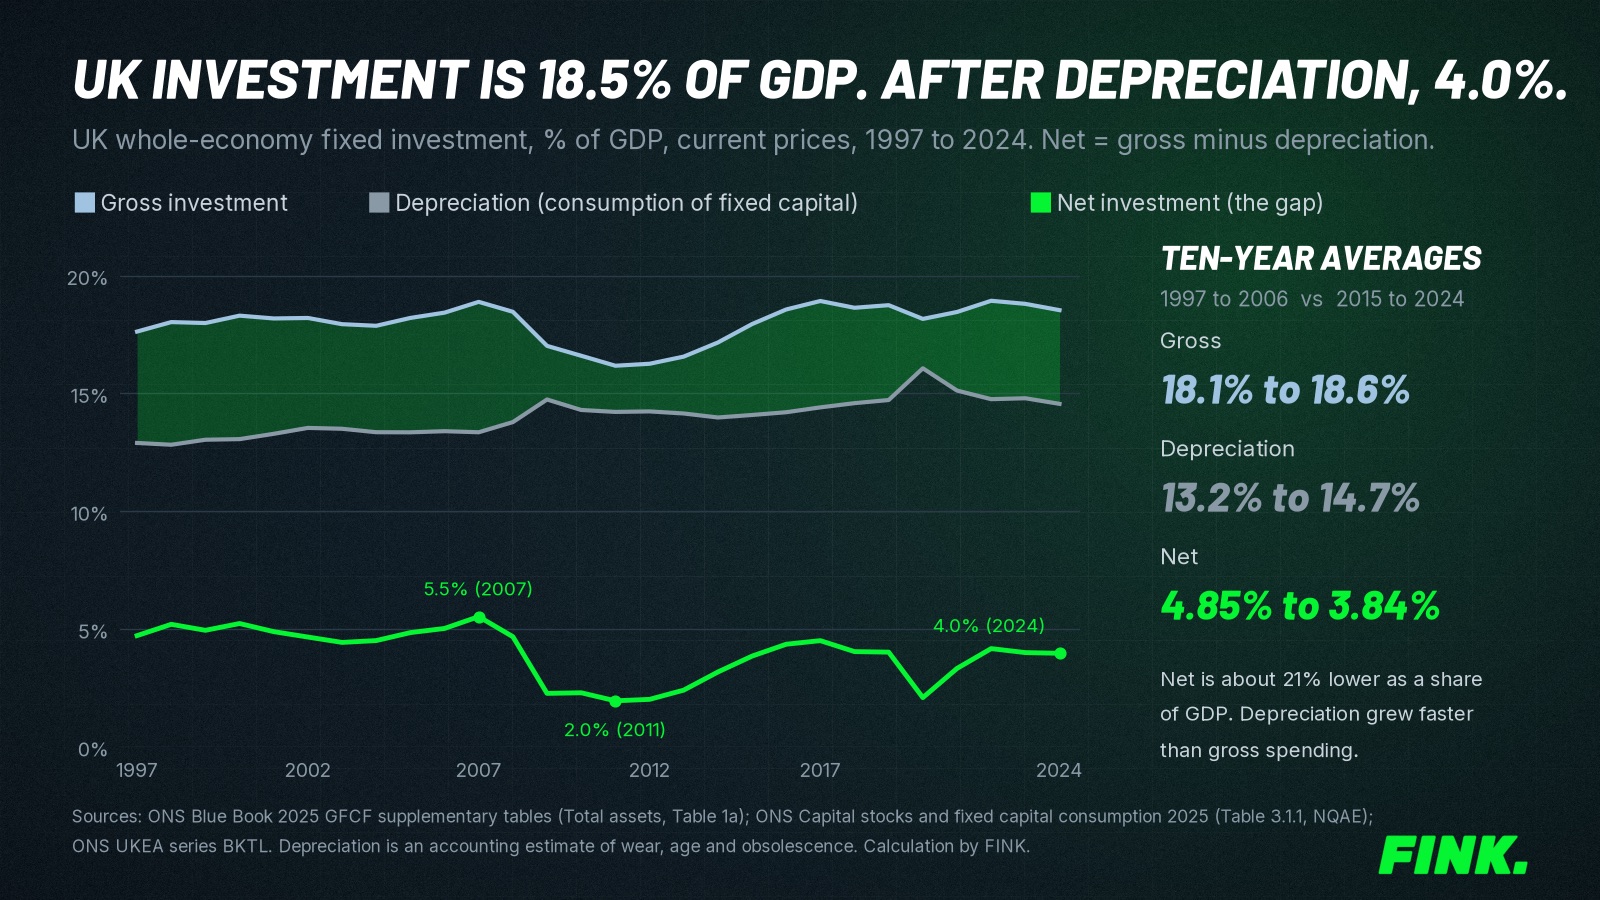
Here's how the chart was built, so you can check it.
- Gross: whole-economy GFCF in current prices from the ONS Blue Book 2025 supplementary tables, Total assets, Table 1a (ONS).
- Depreciation: consumption of fixed capital for all assets, series NQAE, in Table 3.1.1 of the capital stocks dataset released on 27 November 2025 (ONS). The ONS builds that dataset from investment figures consistent with Blue Book 2025, so the two series match.
- GDP: current-price GDP, series BKTL (ONS).
- Net: gross minus depreciation. The % of GDP figures are divided by GDP in the same year's prices, so those shares don't need an inflation adjustment. The £bn figures are in current prices.
| Measure, % of GDP | 1997 | 2007 | 2011 | 2020 | 2024 | Average 1997 to 2006 | Average 2015 to 2024 |
|---|---|---|---|---|---|---|---|
| Gross investment | 17.6% | 18.9% | 16.2% | 18.2% | 18.5% | 18.1% | 18.6% |
| Depreciation | 12.9% | 13.4% | 14.2% | 16.1% | 14.6% | 13.2% | 14.7% |
| Net investment | 4.7% | 5.5% | 2.0% | 2.1% | 4.0% | 4.85% | 3.84% |
| Net, £bn (current prices) | 45.1 | 85.5 | 32.7 | 44.7 | 115.5 |
Two dips stand out. After the financial crisis, gross spending fell while depreciation kept running, so net investment more than halved between 2007 and 2009. In 2020, gross spending fell again and depreciation's share of GDP jumped as GDP shrank. The ONS notes the same effect in its output figures: depreciation "did not fall during this period, unlike other types of expenditure."
In pounds, net investment hit £115.5bn in 2024, a record in cash terms. But the economy is far bigger than in 1997. As a share of GDP it's still below where it was before 2008.
Why did net investment fall when gross investment didn't?
Because depreciation grew faster than spending. Over the two decades compared, gross investment rose by about 0.5 percentage points of GDP while depreciation rose by about 1.5 points, so net investment lost about one point.
There are three likely reasons. The data supports each to a different degree.
The mix moved towards shorter-lived assets. Intellectual property products cover software, research and development, databases and similar assets. They made up 20.7% of gross investment in 1997 and 26.5% in 2024 (Blue Book 2025 asset tables, FINK calculation).
Short lives mean high depreciation. A shift towards software and research pushes depreciation up even if total spending stays flat.
The stock got older and bigger relative to new spending. From 2009 to 2013, gross investment hovered between 16.2% and 17.0% of GDP. Depreciation runs on the whole stock, not on this year's spending, so it didn't fall back with it.
Methods changed. The ONS revised asset lives and added finer asset detail in its 2025 release (ONS, section 6). Revisions like this can move the depreciation line for every past year. That doesn't make the data wrong, but it does mean the level is less certain than the trend.
Where does the UK's net investment actually come from?
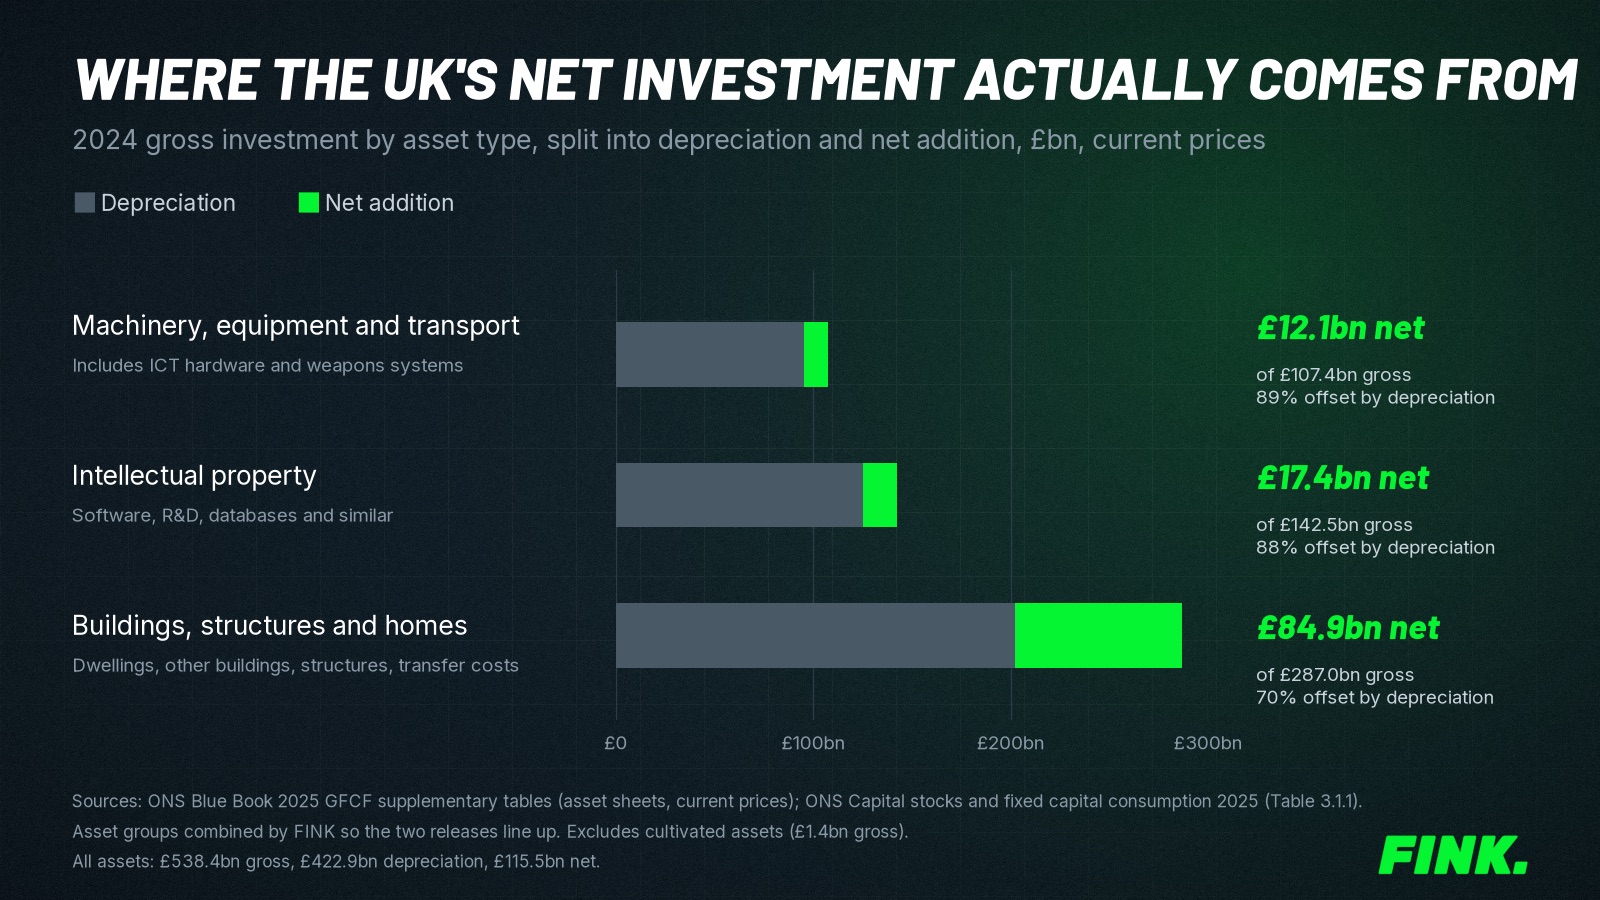
Mostly from buildings, structures and homes. In 2024 depreciation cancelled out 89% of gross spending on machinery, equipment and transport. It took 88% of spending on intellectual property, but only 70% of spending on buildings, structures and homes.
| Asset group, 2024 | Gross investment | Depreciation | Net addition | Share of total net |
|---|---|---|---|---|
| Machinery, equipment and transport | £107.4bn | £95.3bn | £12.1bn | 10% |
| Intellectual property | £142.5bn | £125.2bn | £17.4bn | 15% |
| Buildings, structures and homes | £287.0bn | £202.2bn | £84.9bn | 74% |
| All assets (incl. cultivated assets) | £538.4bn | £422.9bn | £115.5bn | 100% |
Method: gross figures from the Blue Book 2025 asset sheets and depreciation from Table 3.1.1 of the capital stocks dataset, both at current prices. Each figure is rounded on its own, so some rows don't match exactly when you subtract. The two releases group assets slightly differently, especially transfer costs on property, so FINK combined homes, other buildings, structures, land improvements and transfer costs into one group. The asset rows show £277m less depreciation than the all-assets total. The ONS says gaps like this come from terminal and transfer costs.
This is the most useful finding in the data and it rarely makes the headlines. The machines, vehicles and software British businesses buy each year are mostly replacing what they already had. About £12bn of net addition from more than £107bn of spending on kit isn't much for an economy of £2.9tn.
The ONS saw the same pattern in homes. In its 2025 release it said housing investment "was broadly offset by capital consumption in constant prices" in 2024. The dwellings stock grew just 0.7% (ONS).
How big is the gap in pounds?
About £233bn over ten years, in current prices. That's the extra the UK would have added to its capital stock between 2015 and 2024 at its 1997 to 2006 net investment rate of 4.85% of GDP.
The method is simple. For each year from 2015 to 2024, take 4.85% minus that year's actual net share, then multiply by that year's GDP. Add up the ten results.
Treat it as a sense of scale, not a forecast. It assumes the earlier average was a fair benchmark, which is a choice.
It's also well below the Productivity Institute's estimate of a capital gap of up to £2tn against peer countries as at 2019 (Business and Trade Committee, paragraph 8). That estimate compares the UK with other countries over a longer period. Ours compares the UK only with itself.
What about public investment?
Public sector net investment is set to fall as a share of GDP even as gross investment rises. The OBR forecasts 2.9% of GDP in 2026-27, falling to 2.3% by 2031-32.
The numbers come from the OBR's October 2026 outlook. Public sector gross investment rises from £170.7bn in 2026-27 to £186.0bn in 2031-32. Public sector depreciation rises faster, from £78.1bn to £96.8bn. Net investment goes from £92.6bn to £89.2bn (OBR, Economic and fiscal outlook, October 2026, Tables A.7 and A.9).
That's the whole-economy story in miniature. Depreciation takes 46% of public gross investment in 2026-27 and 52% by 2031-32, on FINK's arithmetic from those tables. The OBR says general government depreciation is £0.8bn higher in 2026-27 than it expected in its March 2026 forecast, "mostly due to higher depreciation rates in outturn".
Depreciation matters for the fiscal rules too. The OBR defines the current budget deficit as current spending plus depreciation minus current receipts. So depreciation is treated as a running cost that taxes have to cover. Under the rule that the current budget must balance, borrowing is only for net investment.
Is there a case that the net figures overstate the problem?
Yes. Weigh these before you read too much into one line on a chart.
- Depreciation is modelled. It depends on assumed asset lives, which the ONS revised in 2025. Different assumptions would move the net line.
- The shift to intangibles is partly healthy. Software and research depreciate fast because they go out of date fast. An economy spending more on them will show higher depreciation without anything going wrong.
- The stock is still growing. The ONS estimates the volume of the UK's net capital stock grew 1.4% in 2024 to £5.6tn. Low net investment means slow growth in the stock, not shrinkage.
- Current-price ratios mix in relative prices. If capital goods get cheaper relative to everything else, the same real investment shows up as a smaller share of GDP.
- The latest years will change. Blue Book 2026 revised gross investment up by about £19.8bn for 2023 and £4.5bn for 2024 (ONS Blue Book 2026 tables). The ONS says matching depreciation estimates are due in December 2026. If depreciation isn't revised by as much, 2023's net share will come out higher than shown here.
- Recent spending is picking up. The ONS estimates real gross investment rose 3.4% in 2025, with business investment up 3.9% and government investment up 8.5% (ONS).
None of that changes the core point. On the ONS's own figures, less of national income goes into genuinely new capital than 20 years ago. The headline measure suggests nothing much has changed.
What does this mean if you invest in the UK?
It's a reminder to check what a headline number is actually measuring. At FINK we look for the figure under the headline, because that's usually where the story is.
Here's a short checklist for reading any UK investment story:
- Gross or net? Most headlines are gross. Ask what's left after depreciation.
- Whole economy, business or public? They move differently. IPPR's 11.1% is business only. The Business and Trade Committee's 17.3% is the whole economy.
- Current prices or real terms? Shares of GDP are usually current prices. Growth rates are usually real.
- Which vintage? Blue Book revisions can move a year's figure by billions.
- What kind of asset? £1bn on software lasts nowhere near as long as £1bn on a bridge.
The same logic works on a company. The rough company version of gross versus net investment is capital expenditure against depreciation and amortisation.
Say a company reports £120m of capex and £100m of depreciation and amortisation. That's an illustration, not a real firm.
On its accounts, it's spending 1.2 times what its assets lose in value each year. A ratio stuck near 1 for years suggests it's mostly standing still. One well above 1 suggests it's building.
It's a rough test with real limits. Company depreciation is usually based on what assets originally cost, while the ONS figure is based on current values. So inflation flatters company ratios.
IFRS 16 applies to periods from 1 January 2019. Under it, companies put most leases on the balance sheet as right-of-use assets and depreciate those assets. That can raise depreciation without any matching capex (IFRS Foundation).
Acquisitions add assets that never pass through capex either. So a capex against depreciation check belongs in a wider thesis, not on its own. Our investment thesis template with "what would prove me wrong" lines shows where a check like this fits. Our six checks before you buy a holding cover the rest.
If you've read our piece on what frozen tax thresholds mean for your savings, you'll see a pattern. Both stories turn on a figure that looks flat in the headline while something underneath it quietly moves. For how a UK view fits into a wider portfolio, start with our guide to running a stocks and shares ISA as a process.


