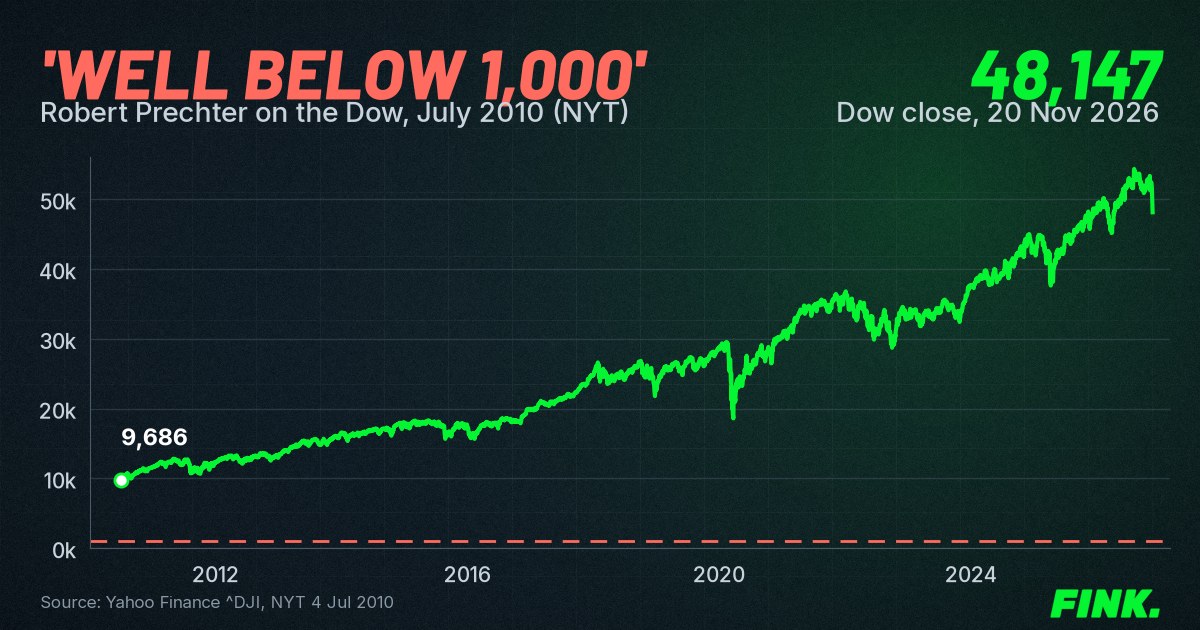

Robert Prechter told the New York Times the Dow would fall below 1,000. It's now at 48,147.
That was July 2010.
The Dow stood at 9,686, and Prechter, one of America's best-known forecasters, said it would likely drop well below 1,000 over perhaps five or six years (reported by the NYT, via Carl Richards).
On 20 November 2026 the Dow closed at 48,147 (Yahoo Finance). That's almost five times the level he called it from.
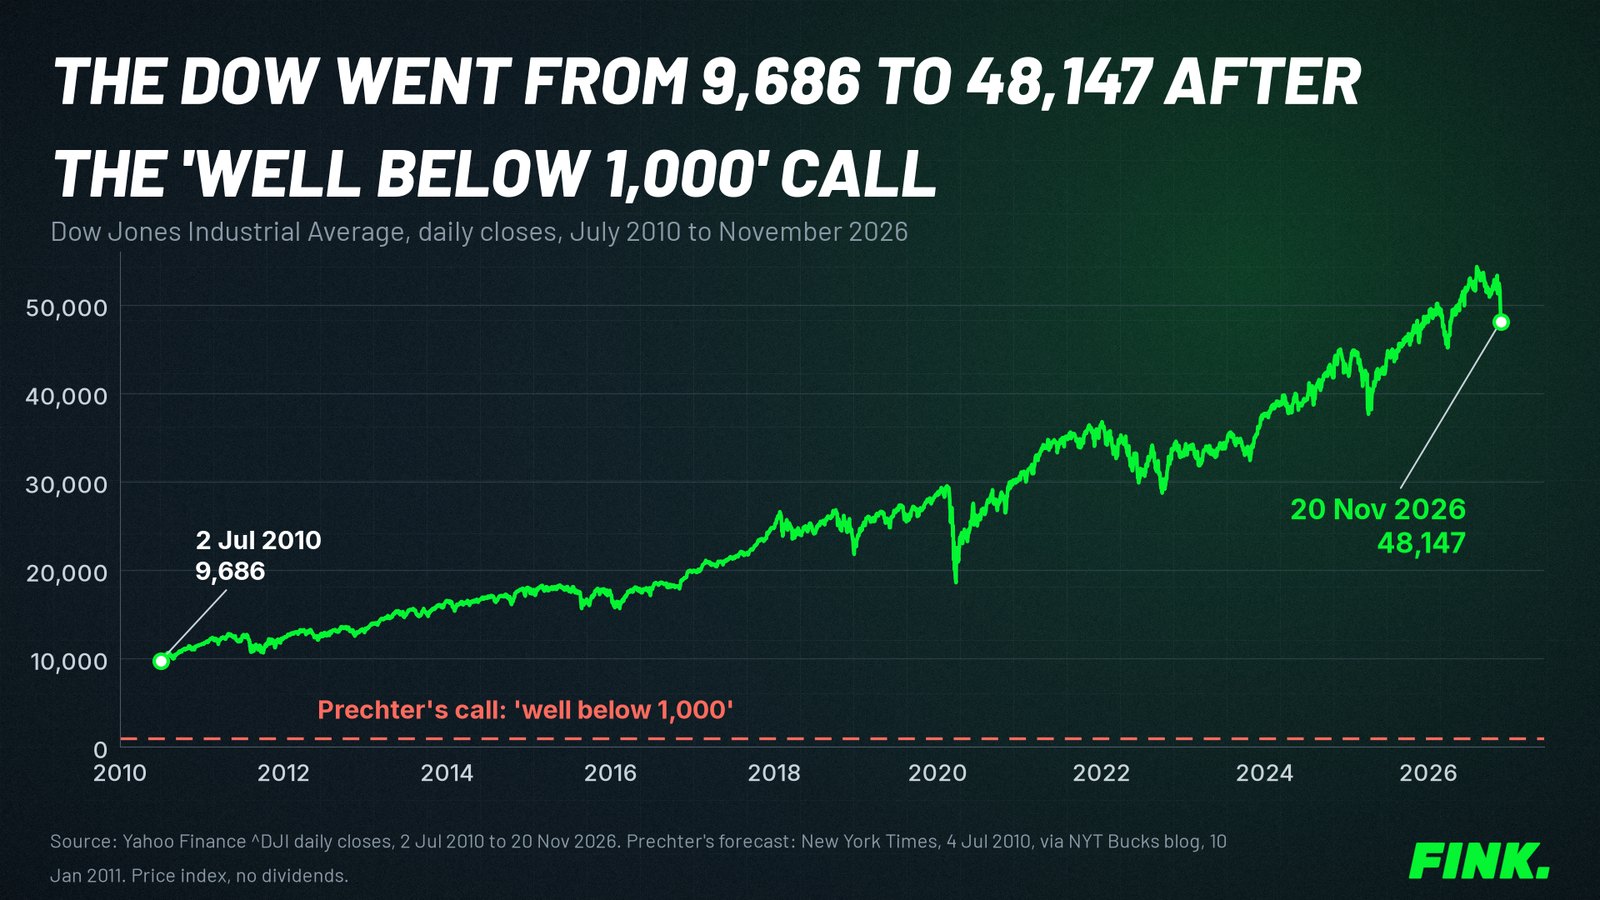
And he's still selling the monthly letter he's written since 1979 (Elliott Wave International).
Forty-seven years of it. The letter, it turns out, is a lot more reliable than the forecast.
Stock market crash predictions are among the best products in finance for the person selling them.
They're among the worst for the person acting on them.
By the end of this you'll know why, and you'll have one question that sorts every forecaster you'll ever read.
Doom is a very good business model
Fear gets read.
A headline saying the market went up again this year gets a shrug. A headline saying your pension's about to be wiped out gets clicked, shared and quoted on the radio by lunchtime.
Sit in the seller's chair for a second.
If the crash comes, he's a genius and the phone won't stop ringing.
If it doesn't, it's only been delayed. And you should probably renew while he keeps watching.
He gets paid whichever way it goes.
But... you don't get that deal.
You're the one sitting in cash while the market walks off without you. He's the one sending the renewal invoice (very promptly, I'd imagine).
That's how the doom business works.
Yes, we sell research and opinion too
Now look, you've spotted the obvious problem.
FINK publishes research, we have opinions, and yes, we charge for some of them (of course we do).
So what's the difference?
Prechter sold a certainty. Dow below 1,000, full stop, with no stated way of being wrong.
We sell probabilities.
A probability tells you what usually happens and how often it doesn't. More importantly, it tells you what you do on the occasions it doesn't.
That last part is the bit the doom crowd never writes down.
We write it down before we buy (what would make us sell, in plain words). An opinion with no exit is just a prediction with better manners.
To be clear, that doesn't make us right.
It makes us cheap to be wrong about.
And that's the test I'd apply to us as well as to him...
Why stock market crash predictions keep missing
The number the doom crowd leaves off the chart is the long-run record.
From 1928 to 2025 the S&P 500 grew by about 10% a year with dividends reinvested, according to NYU professor Aswath Damodaran's data (Damodaran, histretSP).
It lurched its way there (it's a market, and markets lurch) through some horrible years, 1931 and 2008 among them.
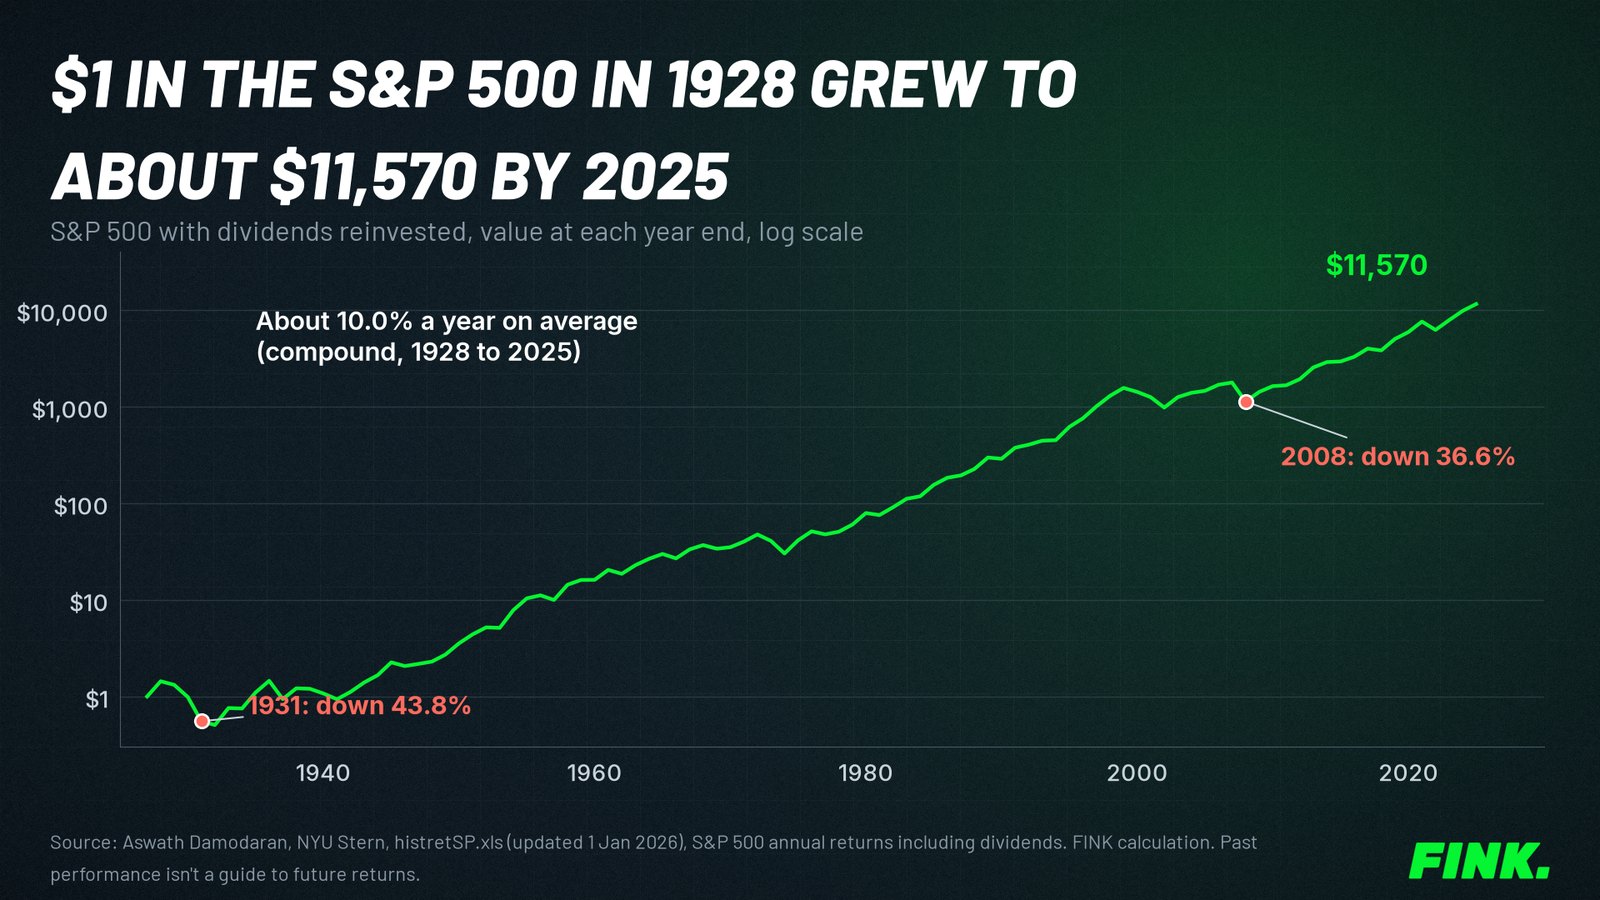
Up is still where it's mostly gone.
So who's really taking the risk?
The person waiting for the collapse thinks he's being careful. In effect, he's betting against what's happened most of the time... and calling it prudence.
Crashes do happen. Anyone who tells you otherwise is selling something too.
But a drawdown is an event. It hurts, then it passes.
Doom is a posture people hold for years... and that's where the money goes.
I got inflation wrong too
You're entitled to ask whether I'm any different. Fair question.
When inflation took off, I got it completely wrong.
I was going by the old line of don't fight the Fed. I believed it would be transitory, right up until Jerome Powell told the Senate on 30 November 2021 that it was probably time to retire that word (Roll Call).
Being wrong alongside the Fed chair was cold comfort...
It changed how Tim and I built everything at FINK.
A macro call is something you don't control, whether it's doom or boom. Being right about it pays nothing on its own.
What pays is a process that doesn't need you to be right.
So we put every piece of macro news into one of two boxes. One helps us make money. The other distracts us from making it.
For me, 99% of it goes in the second box. (Most of the financial press lives there full time.)
What acting on doom costs you
Now for what it actually costs.
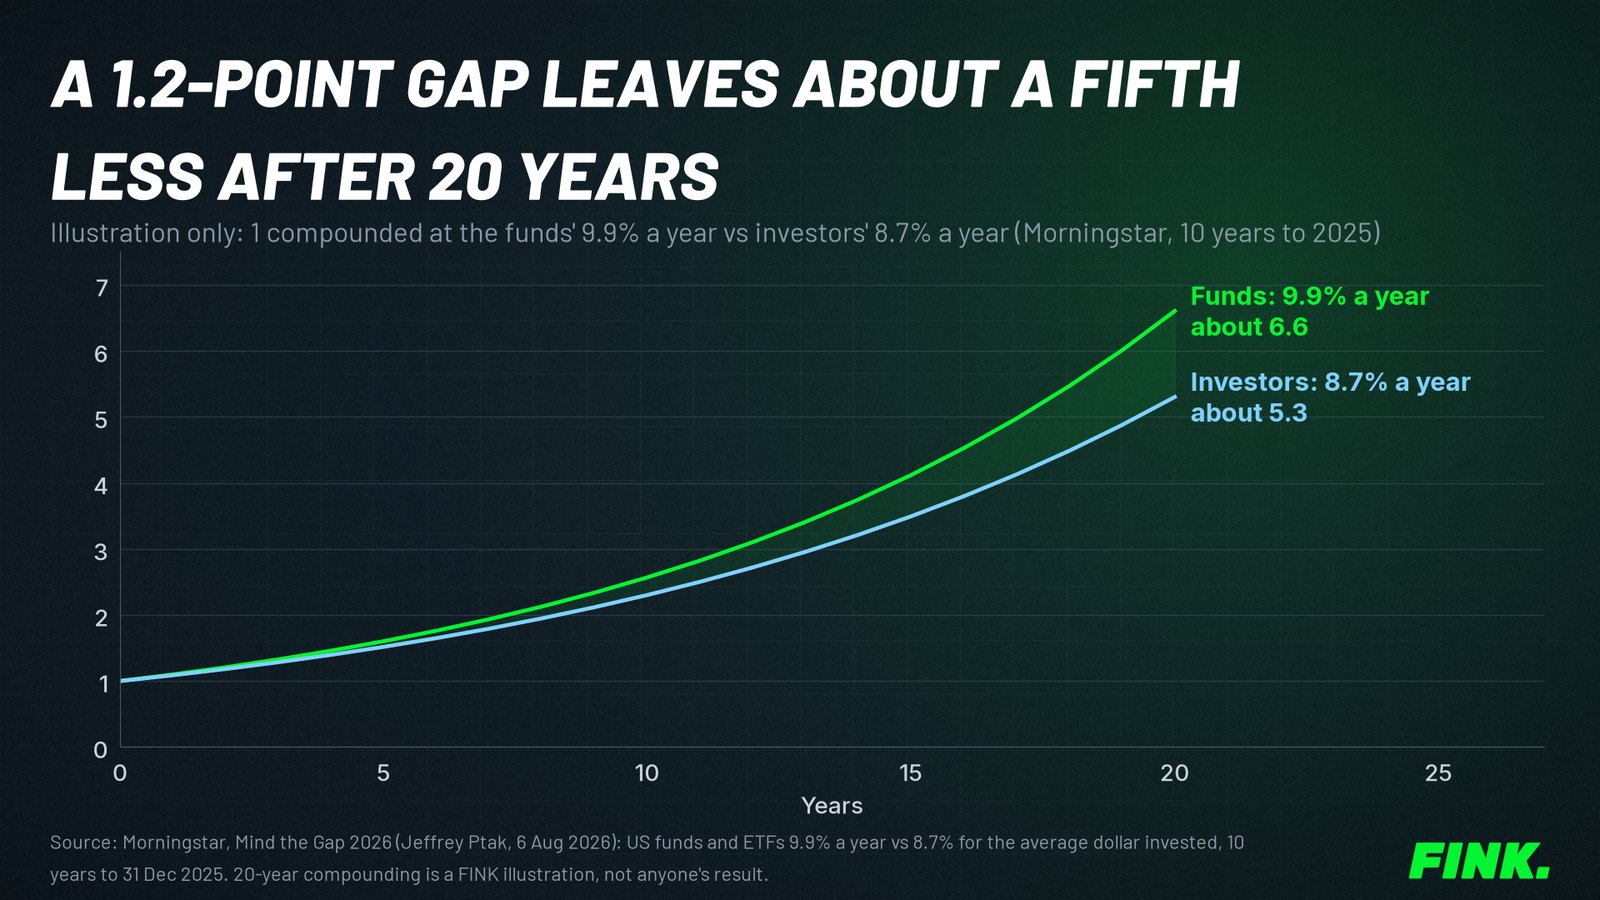
Morningstar checks this every year. Its 2026 study of investor returns found US funds returned 9.9% a year over the ten years to the end of 2025, while the average dollar invested in those funds earned 8.7% (Morningstar).
The funds did their job.
The 1.2 points they lost on the way to the investor came from when people bought and sold.
Here's what that does, as an illustration and not anyone's result.
Compound 9.9% a year for 20 years and every pound becomes about 6.6 pounds. Compound 8.7% and it becomes about 5.3.
Same funds, same two decades, about a fifth less, and the whole difference is behaviour.
The same study had better news for people in plain US stock funds. They mostly sat tight, and kept almost all of what their funds earned.
Doing nothing, it turns out, is a skill. (Nobody's ever sold a newsletter on it.)
Brad Barber and Terrance Odean found the same thing in brokerage accounts.
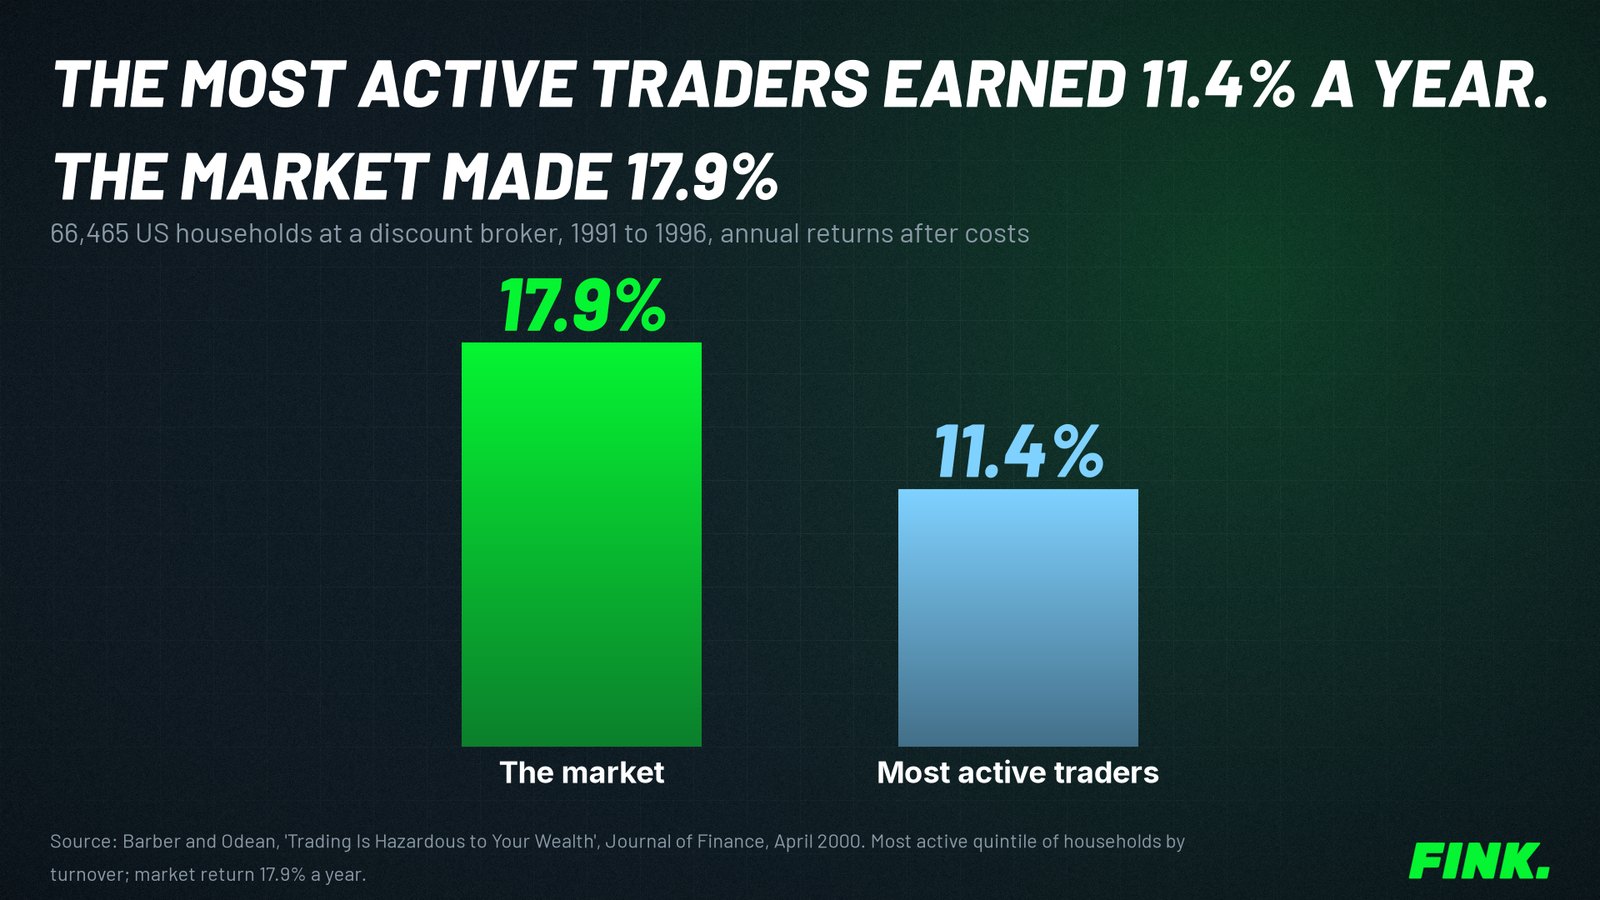
They studied 66,465 US households at a discount broker from 1991 to 1996. The most active traders earned 11.4% a year while the market made 17.9% (Barber and Odean, Journal of Finance, 2000).
Yes, it's a 1990s sample. Ask yourself whether a trading app in every pocket has made people trade less...
They called the paper Trading Is Hazardous to Your Wealth, which is about as blunt as academics get.
Doom feeds straight into that shortfall.
It gets you out after the fall. It only lets you back in once the headlines are friendly and the price has already moved.
And the man selling it never puts that cost on his chart.
That cost is all yours.
Should you wait for a crash before you invest?
Look at what waiting has paid.
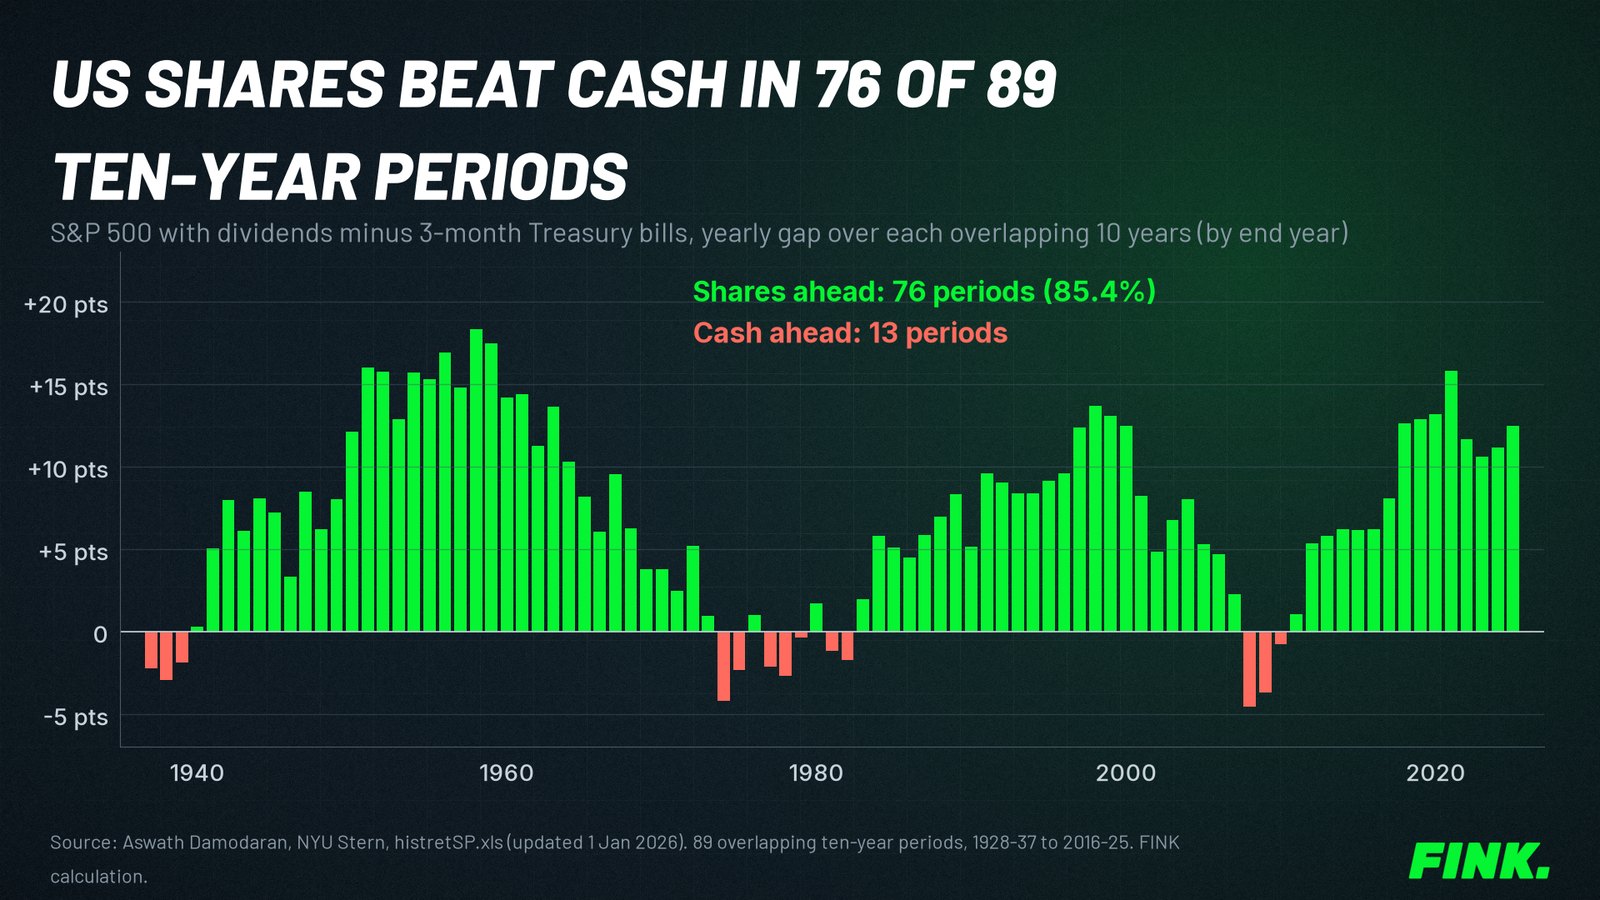
Over the same 1928 to 2025 data, US shares beat three-month Treasury bills in 85.4% of ten-year periods (Damodaran, histretSP, FINK calculation, using overlapping periods).
Cash feels safe while you wait for the all-clear. Inflation eats into it the whole time.
And the all-clear never actually arrives. (There's always another headline.)
The way out is to build something that doesn't need a guess at all.
We decide what would make us sell before we buy, and we write it down. That way a headline doesn't make the call for us in a panic (our investment thesis template shows how).
We think about the whole portfolio rather than a pile of separate bets. That changes what you lose sleep over (how much to put in one stock covers sizing).
The overriding point here is simple.
Judge every source by one question, ours included.
What happens to them if they're wrong?
Prechter's answer is nothing. The letter still goes out, and the Dow is about five times where it was when he called it.
Yours is a retirement that arrives later than it should.
If you'd like to see what US market history says about buying when the doom is loudest, I wrote a free report on exactly that.
When it's time to get out of something, when to sell a stock and the 200 day moving average strategy are better guides than a forecast.
Educational only, not financial advice. Capital is at risk.


