
It sounds almost too simple to matter, yet the S&P 500 has crossed its own 200 day line about six times a year on average since 1928. A huge amount of professional money is set up to react every time it does.
So what's it about one line on a chart that so many serious investors have kept an eye on for the best part of a century? And can an ordinary UK investor with a stocks and shares ISA get anything out of it?
What the 200 day moving average actually is
Take the last 200 daily closing prices, add them up and divide by 200. Tomorrow you drop the oldest day, add the newest and do it again, which is why it's called a moving average. Plot the answer day after day and you get a smooth line that trails the price.
Think of it like the average temperature over the last 200 days. One freezing morning doesn't tell you the winter has arrived, but if the weather has been cooler than that long-run average for weeks on end, you'd be wise to take a coat. Two hundred trading days is almost a whole year of data, so the line only bends slowly. The price is either above it or it isn't and that's a fact on the screen rather than an opinion about the economy.
In the plain version, which is the one the research mostly uses, each of the 200 days counts equally. There are fancier versions that give more weight to recent days, but the simple one is what a lot of the big funds watch.
Why a rule this simple keeps turning up
People have been testing it for a very long time. In 1992 Brock, Lakonishok and LeBaron tested moving average rules on the Dow Jones index from 1897 to 1986 (Journal of Finance, December 1992). They found the days after the average turned up were better and less jumpy than the days after it turned down, in a way the usual random walk models couldn't explain.
Mebane Faber then took the idea to the S&P 500 from 1900 to 2005 using a ten month average, which behaves a lot like the 200 day one. His rule was invested about 70 per cent of the time (Journal of Wealth Management, Spring 2007), and in his 2013 update covering 1901 to 2012 it cut the worst fall from about 83 per cent to about 50 per cent. He's upfront about the catch, which is that it trailed the index in roughly half of all years since 1901 and lagged right through the 1990s. You'd have needed the stomach to look wrong for years at a stretch.
It also works on far more than shares. Moskowitz, Ooi and Pedersen looked at 58 futures and forward markets, from stock indices and currencies to commodities and government bonds (Journal of Financial Economics, May 2012). The past twelve months' direction helped predict the next month in every one of them. Hurst, Ooi and Pedersen at AQR then pushed trend following back to 1880 across 67 markets and found it had made money on average in every decade (Journal of Portfolio Management, Fall 2017). Their version used one, three and twelve month trends rather than a moving average, so it's the same family and not the same rule.
Then there are the people watching. Paul Tudor Jones, one of the most successful macro traders alive, told Tony Robbins in 2014 that his metric for everything he looks at is the 200 day moving average of closing prices. 'You play defense and you get out,' was how he put it.
A big pile of money is also run by trend-following funds (often called CTAs) and volatility-control funds, whose rules look a lot like this one. When the S&P 500 closes under its 200 day line, plenty of that money has to get smaller and when it closes back above, it has to come back. You don't have to like it, you only need to know it's there.
The way I put it to a group of investors in September was that there isn't a man pressing buy and sell on the asset. All the computer knows is what a number tells it over a certain time period, so it's just a stupid machine. A moving average has no story about the company, no view on the Fed and no ego to protect.
A worked example from the S&P 500, 2007 to 2009
The last big bear market is a good test of the line, so we can look at it using the S&P 500's own daily closes.
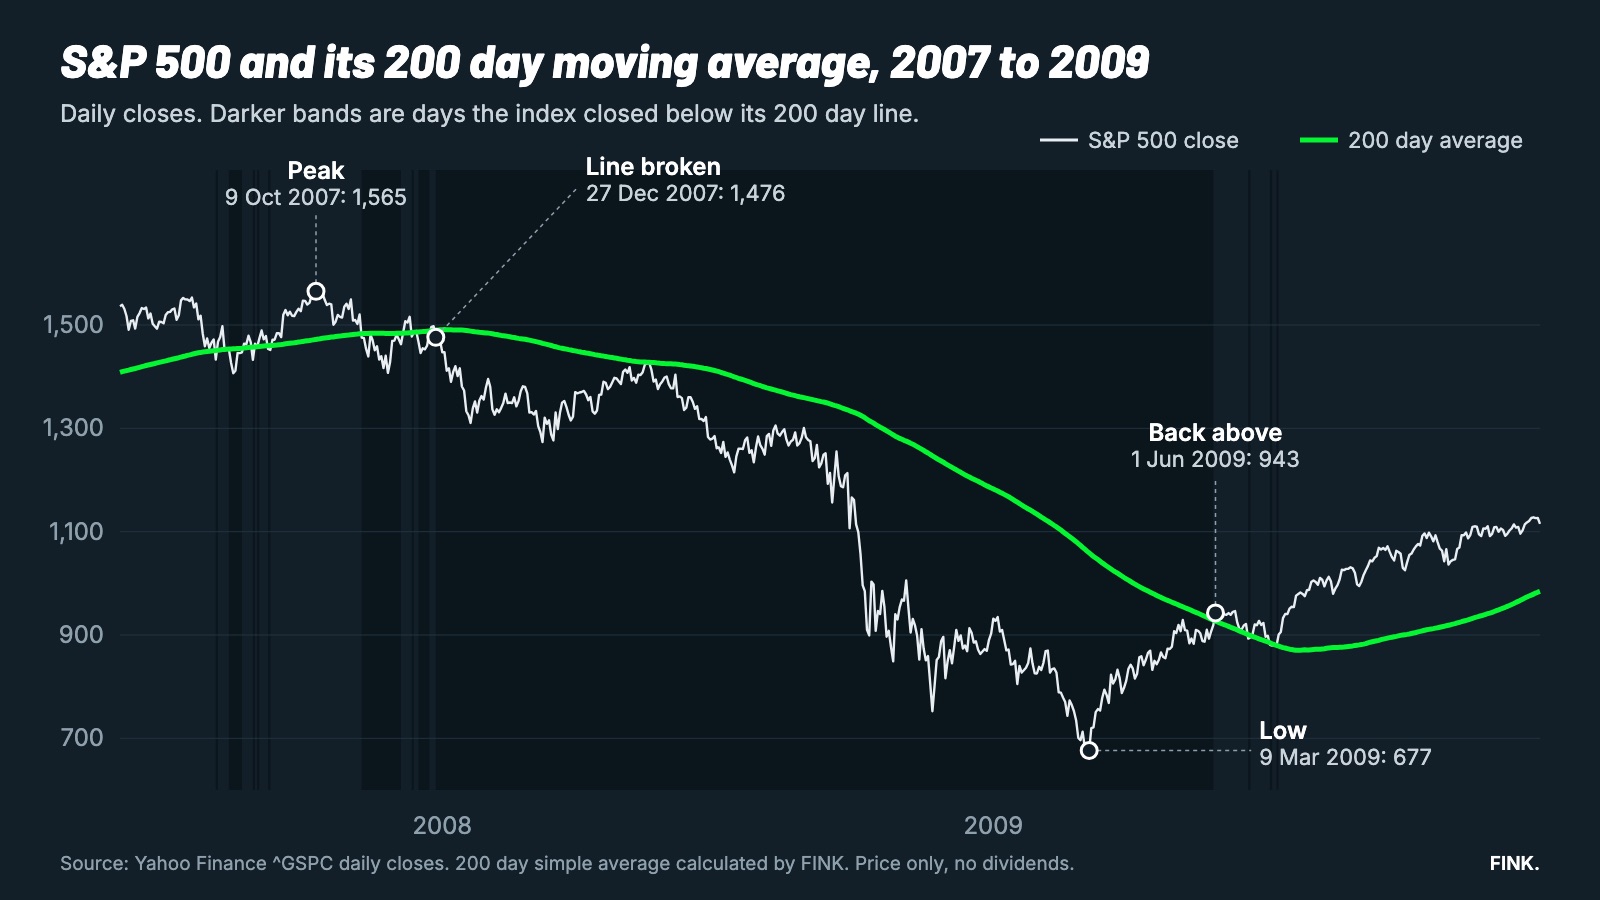
The index reached its peak close of 1,565.15 on 9 October 2007, comfortably above its 200 day average of about 1,472. The first close under the line came on 7 November and then it did what it so often does around the line, which is to wobble. It closed back above on 5 December, below on 11 December, above on 12 December, below on 14 December and above again on 24 December. On 27 December it closed at 1,476.27 against an average of about 1,490 and it didn't close above the line again for seventeen months.
From that close to the low of 676.53 on 9 March 2009 the index fell about 54 per cent and it didn't close back above its average until 1 June 2009, at 942.87.
To picture the plain textbook rule with round numbers, say you owned £10,000 of an S&P 500 tracker at the end of December 2007 and had decided in advance that the first close under the line meant stepping aside into cash. That's an example and not a record of anyone's account and it ignores currency moves, dealing costs and tax. The plain rule would have had you out at around the 1,478 level of 28 December, with the cash sitting there while the index went on to fall by more than half. It would have put you back in at around 943, about 36 per cent lower than where you left, though only after the index had already climbed for a few months.
It's worth being honest about the shape of that. The rule didn't call the top, since the index was about 6 per cent under its peak by the time the line was clearly broken. It didn't call the bottom either, because the index was about 39 per cent above the low when the rule would have put you back in. That's what a trend rule does, because it doesn't predict anything and only responds.
So is that how I'd use it? No. A full exit on the first close under the line looks clever in 2008 and 2001. It looks foolish in the dozen head-fakes between them, when the index slipped under the line and was soon back above it without you. I use the line to take a little risk off, not to go to cash. What I'm after is a slightly smoother ride, not a system that never lags, because no trend rule ever manages that.
What the 200 day moving average strategy does in practice
If you count the crossings on the S&P 500 since 1928 (Yahoo Finance daily closes, FINK calculations), you get about six a year. The index spent around 68 per cent of its days above the line and 32 per cent below it. It's also been within 5 per cent of the line on about 39 per cent of days, which is why the crossings are so frequent and so many of them are false alarms.
The more interesting number is what happened on the worst days. Since 1928 the S&P 500's worst one per cent of days have been falls of 3.43 per cent or more. About two thirds of them came when the index had closed the previous day below its 200 day line, even though it spent only about a third of its time there. If you're asking whether the line tells you anything, that's one fair answer, because the bad days cluster below it.
The plain version above, the close against the average and nothing else, is the one the research is mostly about.
Where it lets you down
I only trust the idea because it's honest about where it fails, so these are the places it does.
It chops in a sideways market. From January 2022 to the end of 2023 the S&P 500 crossed its 200 day line 24 times, 13 in 2022 and 11 in 2023. Every crossing in a sideways market is a small round trip and the costs and the frustration add up. In my own backtests the plain rule switched about three times a year on average since 1928.
There's a pattern in those false alarms too. Since the late 1990s, most breaks below the line that came after a long stay above it were recovered quickly. That's why I wait for the market to confirm a break rather than acting on one bad day.
It can't beat a very fast crash. Hurst, Ooi and Pedersen point to 1987 as the weakness, when the market fell too quickly for trend followers to react. On 19 October 1987 the S&P 500 fell about 20 per cent in one session and a rule that only looks at closes can't act on a gap like that.
The good news in their work is that most bear markets unfold over months. The ten worst falls for a 60/40 portfolio took about 15 months on average to go from peak to trough, which gives a trend rule time to notice, but it doesn't help with the fast ones.
It lags the recovery. You'll always be late back in, as the 2009 example shows and that's the price of the protection.
It's far less convincing on the FTSE 100. When I ran the same test on the FTSE 100, the results were noticeably weaker than on the US indices, which is one reason this article sticks to the S&P 500. If you're a UK investor wondering whether to apply it to a UK tracker, that's a fair question to ask before you do and the honest answer is that the evidence is thinner.
It also knows nothing about the business behind a share, since it can tell you a price has been falling but not why.
Where it fits in our process
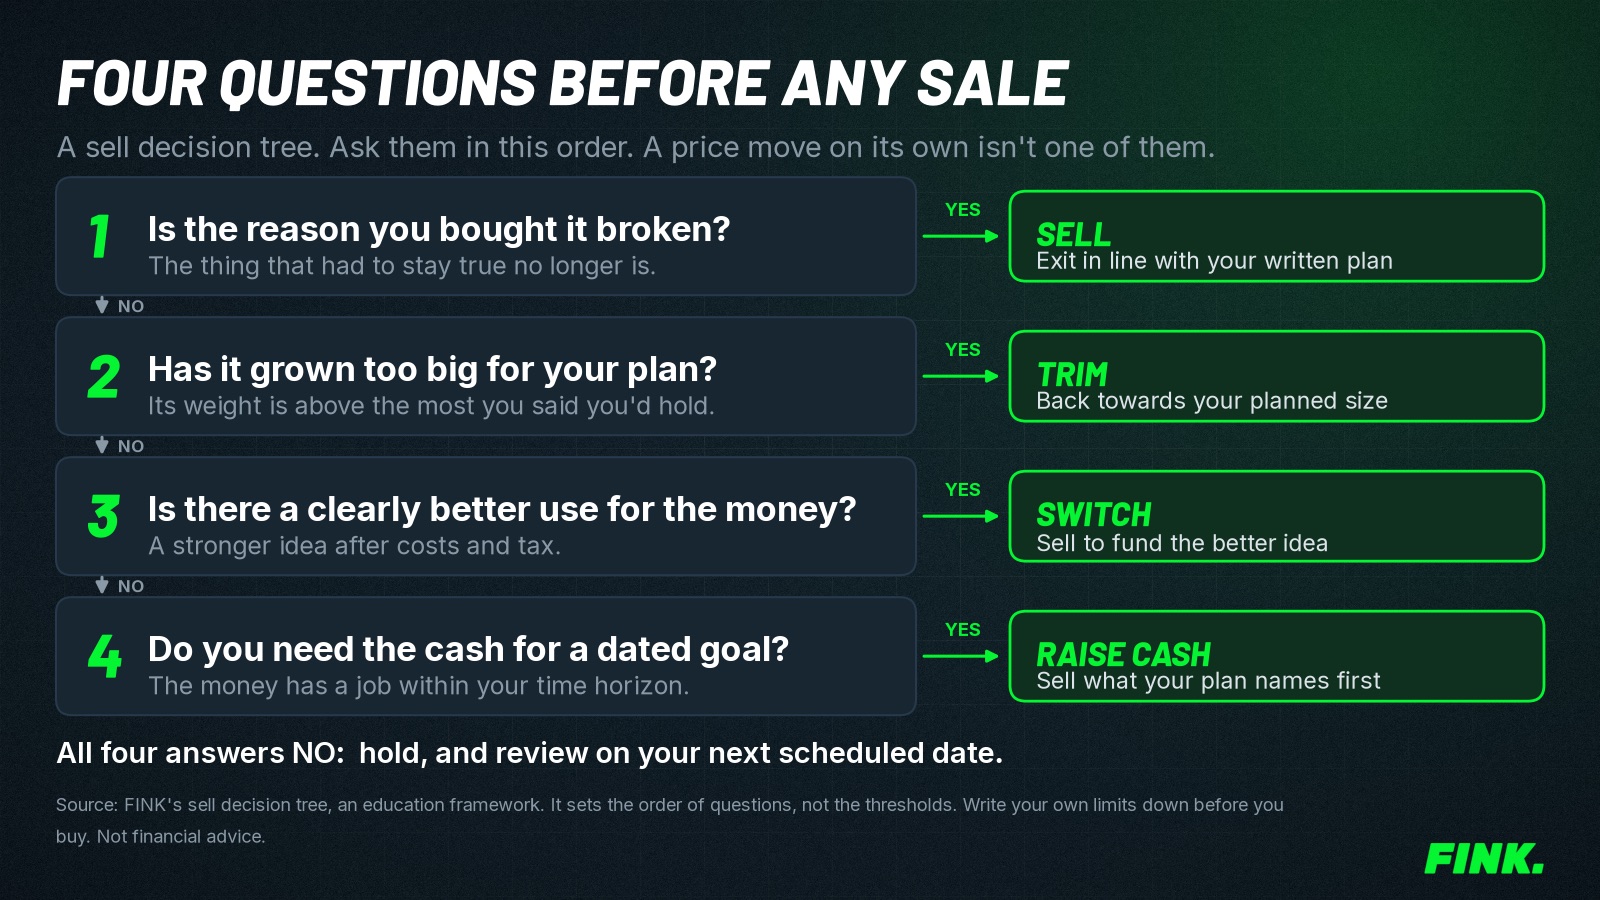
Everything we do at FINK goes through five layers, Qualify, Enter, Size, Manage and Exit. A company has to earn its place on the fundamentals and the theme before a moving average gets any say at all, which is why Qualify comes first and why a chart line is never a reason to own something. Once a position exists, trend lines like this one are part of how we think about Manage and Exit, alongside how much to put in one stock.
The reason it matters is that most people have no rule at all for getting out. They hold things all the way down because they've got a story about it and a story is lovely until the share price is down 80 per cent. When we went back through 36 calls with investors and people thinking of joining, from March to October 2026, getting out of positions came up in 17 of them.
That's the problem the free report Good at buying, terrible at selling is about. It covers what the research says about why we sell winners too early and hold losers too long, including a UK study of 4,328 investors and how to build a selling process you'll actually follow. If a rule you decide on in advance sounds more useful to you than a decision you make on your worst day, read the free Good at buying report.
Using the idea inside a UK stocks and shares ISA
This is the question a UK reader usually asks next. Inside a stocks and shares ISA, gains are free of capital gains tax and income tax (GOV.UK), so stepping out of an investment to cash inside the wrapper doesn't create a tax bill. The money stays inside the ISA while it waits, so you aren't using up a fresh allowance when you go back in. The detail on settlement and costs is in our guide to selling shares in a stocks and shares ISA.
Costs still count, because every switch has dealing fees, a spread and sometimes a settlement delay. The 2022 and 2023 crossings are why most people who like the idea keep it for the slow core of a portfolio and not for every holding. If you want the wider ISA picture, start with our Stocks and Shares ISA strategy guide and see how to rebalance a stocks and shares ISA for how a rule like this sits next to normal rebalancing.