
What percentage of my portfolio should one stock be?
Short answer: most published guidance lands between 2% and 5% for a single share, with 10% treated as the point where one company starts to dominate. None of these are rules. It's a range people use because the maths of losses makes it comfortable.
Here's what the main published sources say, side by side.
| Source | What it says about one holding | Basis |
|---|---|---|
| interactive investor, Portfolio Dilemma (24 July 2026) | Satellite share 2% to 5%. Core holding such as a broad tracker 10% or more. Under 2% "will do very little to move the dial" | Rule of thumb |
| Compounding Investor | No universal maximum. Treat a limit as a review trigger, not an automatic sell | Framework |
| UK Dividend Stocks portfolio review (summer 2026) | One investor's equal-weight approach with rebalancing bands either side of the target weight | Personal rule |
| FCA Handbook COLL 5.2.11R | Regulated UCITS funds: 5% per issuer, raised to 10% for holdings making up no more than 40% of the fund | Regulation |
The trouble with a bare percentage is that it ignores what changes the answer. That's how many holdings you run, how much you already own of the same company through funds and how much of a loss you can live with. The rest of this guide is about those three.
The 5/10/40 rule: a real-world benchmark
The closest thing the UK has to an official answer is the spread rule for regulated funds. Under COLL 5.2.11R, a UCITS fund can't normally hold more than 5% of its value in securities from one issuer. That limit rises to 10% for some holdings, as long as everything above 5% adds up to no more than 40% of the fund. Hence the shorthand 5/10/40.
Index trackers get a looser limit. COLL 5.2.31R lets a fund that replicates an index hold up to 20% in one company, or 35% for a single company in exceptional market conditions.
Here's what this benchmark is and isn't.
It was written for pooled funds sold to the public, where the manager isn't you and the investors can't see every decision. It isn't a personal rule for your ISA. But it does tell you where regulators drew the line for "a prudent spread of risk", which is the phrase the rule itself uses. If a single share is above 10% of your portfolio, you're running more concentration than an ordinary UK fund is usually allowed to.
What does the research say about one big position versus many small ones?
The evidence pulls in two directions, which is why sizing is a judgement and not a formula. Diversification research says you need a fair number of holdings to cut company-specific risk. Return research says the rewards in stocks come from a small number of extreme winners.
The case for spreading out
Meir Statman's 1987 study, How many stocks make a diversified portfolio?, compared the falling risk from adding stocks with the cost of doing so. It concluded that a well-diversified portfolio of randomly chosen stocks needed at least 30 stocks for an investor who borrows and 40 for one who doesn't. Later work has argued the number is higher in some markets and periods, but the shape of the finding holds: the first ten holdings cut risk a lot. Each one after that cuts it by less.
The other half of the case comes from Hendrik Bessembinder's Do stocks outperform Treasury bills? (Journal of Financial Economics, 2018). Looking at every US common stock in the CRSP database from 1926 to 2016, he found:
- Only 42.6% of stocks beat one-month Treasury bills over their lifetimes.
- More than half had negative lifetime returns. The single most common outcome was a loss of 100%.
- The best-performing 1,092 companies, about 4% of the total, accounted for all of the net wealth the US market created over the period.
His own conclusion is that this "helps to explain why poorly diversified active strategies most often underperform market averages". If most single stocks disappoint and a few carry the market, a portfolio of five names has a decent chance of holding none of the few.
The case for concentrating
The same skew is also the argument for letting winners run. If a handful of extreme performers drive the outcome, trimming them early cuts out the part of the distribution that does the work. The interactive investor column makes a related point: below about 2%, a position barely moves the portfolio even if it does very well.
And the people who've done well inside ISAs aren't all spread thin. AJ Bell reports its ISA millionaires hold 23 positions on average, ranging from more than 150 holdings down to a single one. That's survivorship. We see the concentrated portfolios that worked, not the ones that didn't.
What we take from it
At FINK we read the evidence this way: concentration isn't wrong, but it has to be chosen, sized and reviewed on purpose. The danger is concentration that arrives by accident, either because a winner grew or because you own the same company three times through different products.
How do you work out how much to put in one stock?
Start from the loss, not the hoped-for gain. Decide how much of your whole portfolio you'd accept losing if this one idea went badly, estimate how far the share could plausibly fall, then divide one by the other.
The loss table
Before any method, it helps to see what a position size means in pounds and pence. This is pure arithmetic: the hit to the whole portfolio equals the position size times the fall in the share.
| Position size | Share falls 30% | Share falls 50% | Share goes to zero |
|---|---|---|---|
| 2% | 0.6% | 1.0% | 2% |
| 4% | 1.2% | 2.0% | 4% |
| 8% | 2.4% | 4.0% | 8% |
| 15% | 4.5% | 7.5% | 15% |
| 25% | 7.5% | 12.5% | 25% |
On a £20,000 ISA, a 25% position going to zero costs £5,000. That's a full quarter of the allowance you get in a tax year, gone on one idea. A 2% position going to zero costs £400.
The risk-budget method
It's a common method and you only need a calculator.
- Pick your risk budget per idea. This is the share of your whole portfolio you'd accept losing on one company if you're wrong. Say 1%.
- Estimate a plausible bad-case fall for this share. Look at how far it has actually fallen in past sell-offs. A steady utility and a loss-making tech company won't have the same number.
- Divide the budget by the fall. Position size = risk budget ÷ plausible fall.
- Check it against your ceiling. If the answer comes out above the most you'd ever hold in one company, use the ceiling instead.
Illustration only: say you have £20,000 and a 1% budget, which is £200. For a share that's fallen 40% in past sell-offs, £200 ÷ 0.40 = £500, or 2.5% of the portfolio. For a share that's fallen 60%, £200 ÷ 0.60 = about £333, or 1.7%.
The method's weakness is obvious.
A past fall isn't a cap on a future one. A company can go to zero. That's why the zero column in the loss table still matters. It's also why the ceiling in step 4 exists.
Why this beats a flat percentage
A flat "5% each" rule treats a volatile small cap and a sleepy utility as the same risk. The risk-budget method doesn't. It gives smaller positions to shares that move a lot and larger ones to shares that move less, so each idea carries a similar amount of potential damage.
How does position size change with conviction?
Conviction can move a position between a floor and a ceiling you set in advance, but it shouldn't move the ceiling. Brad Barber and Terrance Odean's study of US brokerage accounts pointed to overconfidence as the likely reason the busiest traders did worst (Journal of Finance, 2000), as we cover in individual shares or funds in your ISA. The moment you're most sure is usually the moment you're most tempted to break your own limit.
A simple way to build this in is a three-step sizing ladder. You choose the numbers. The structure does the work.
- Starter. A smaller first position while the idea proves itself. It caps the cost of being early or wrong.
- Full. The size you'd hold once the reasons you bought are confirmed by results, not by the share price alone.
- Ceiling. The most one company is allowed to be. Reaching it triggers a review, which may or may not end in a trim.
There's a practical reason for a gap between full size and the ceiling. As the author of UK Dividend Stocks puts it, if you open positions at your maximum size, the slightest rise in the share price pushes them straight over the limit.
The ladder ties naturally to how many holdings you run. Equal weight is just 100% divided by the number of holdings. The arithmetic below is a worked illustration of one way to set the steps. It isn't a recommendation and it isn't FINK's own numbers.
| Holdings in the share portion | Equal weight | Starter at half | Ceiling at double |
|---|---|---|---|
| 10 | 10.0% | 5.0% | 20.0% |
| 20 | 5.0% | 2.5% | 10.0% |
| 30 | 3.3% | 1.7% | 6.7% |
Two things jump out.
A ten-stock portfolio with a ceiling at double equal weight lets one company reach 20%, which is twice what a UCITS fund is normally allowed. And a 30-stock portfolio's starter position is below the 2% that interactive investor suggests barely moves the dial. Neither is wrong. They're trade-offs you can now see.
If you'd like a starting point for how many holdings to run, our guide to how many shares to hold in a stocks and shares ISA goes through the evidence.
Should I cap my biggest holding?
Most frameworks say yes, as a review trigger rather than an automatic sell. The reason is drift. A holding that does well grows as a share of the portfolio even if you never buy more. It can get large very quickly.
The chart shows the arithmetic. Say one holding's price multiplies while the rest stays flat. Its weight becomes w × m ÷ (w × m + 1 − w), where w is the starting weight and m is the price multiple.
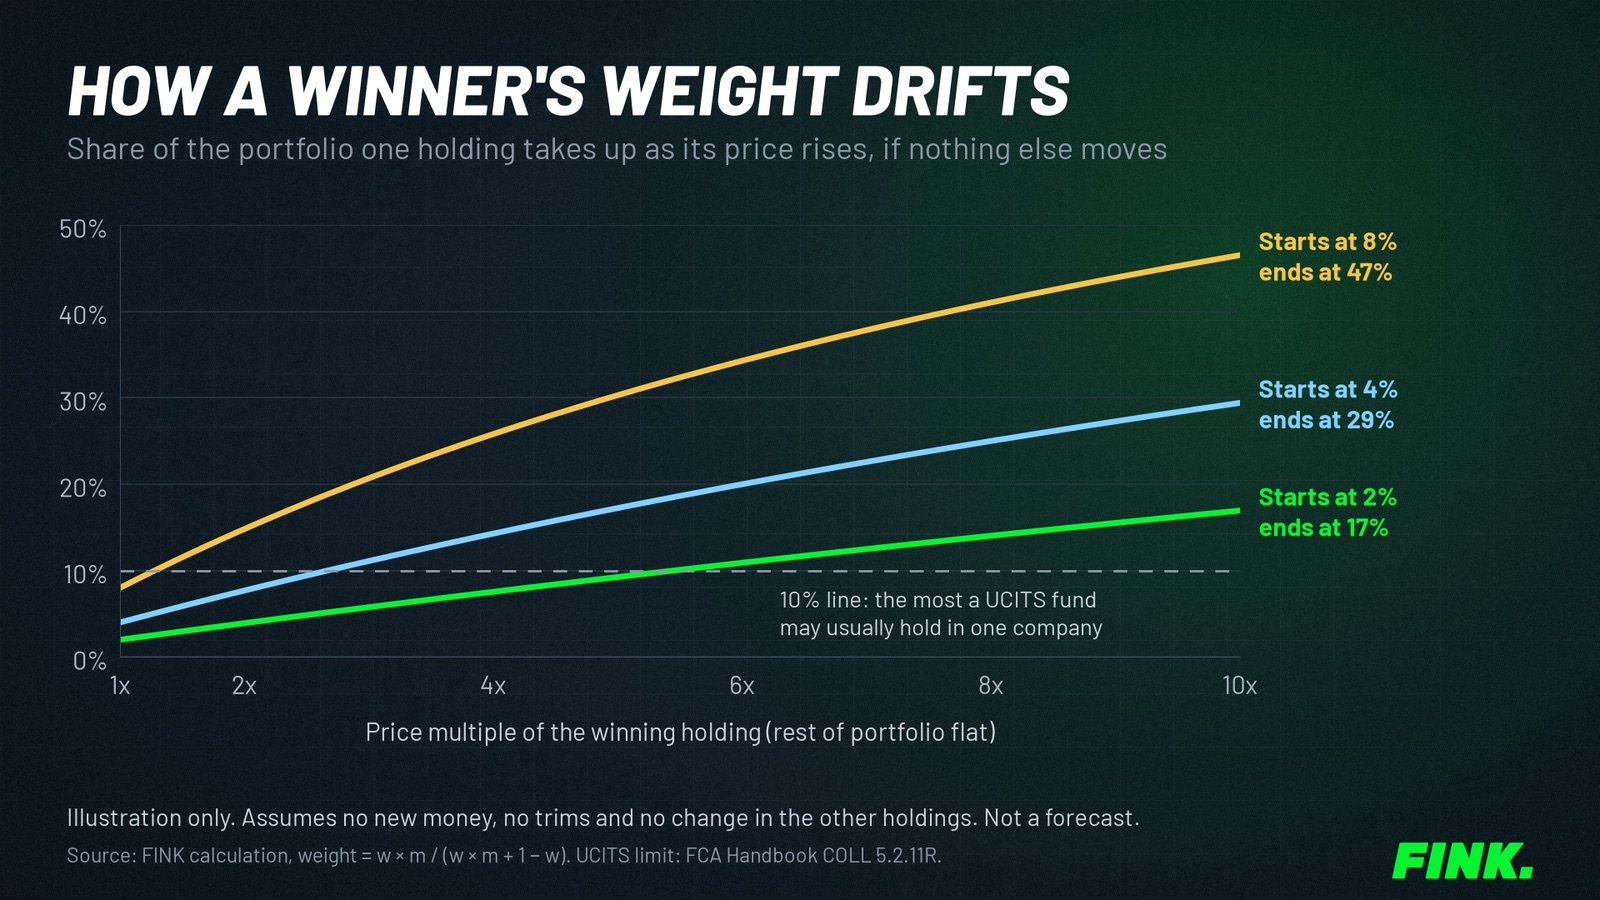
In real portfolios the other holdings move too and new money arrives, so drift is usually slower than the chart. But the direction is the same. It's how people end up with a fifth of their savings in one company without ever deciding to.
What to do when a holding hits your ceiling
A ceiling is a prompt to ask questions, not a button that sells for you. These are the usual options, roughly in order of how much they cost.
- Direct new money elsewhere. In an ISA this is the cheapest fix. Fresh contributions go into the other holdings and the big one shrinks as a share without a sale.
- Stop reinvesting its dividends. Let them build up as cash or go to other holdings.
- Trim back towards full size. Inside a stocks and shares ISA there's no capital gains tax on the sale and no minimum holding period, according to LITRG. Outside an ISA, gains above the £3,000 annual exempt amount are taxed at 18% or 24% for 2026 to 2027, per GOV.UK.
- Accept the concentration on purpose. Write down why. Then write down what would make you change your mind.
How much to trim and when is a big enough question to have its own guide: when to take profits on long-term stocks.
How much of the same company do you already own through funds?
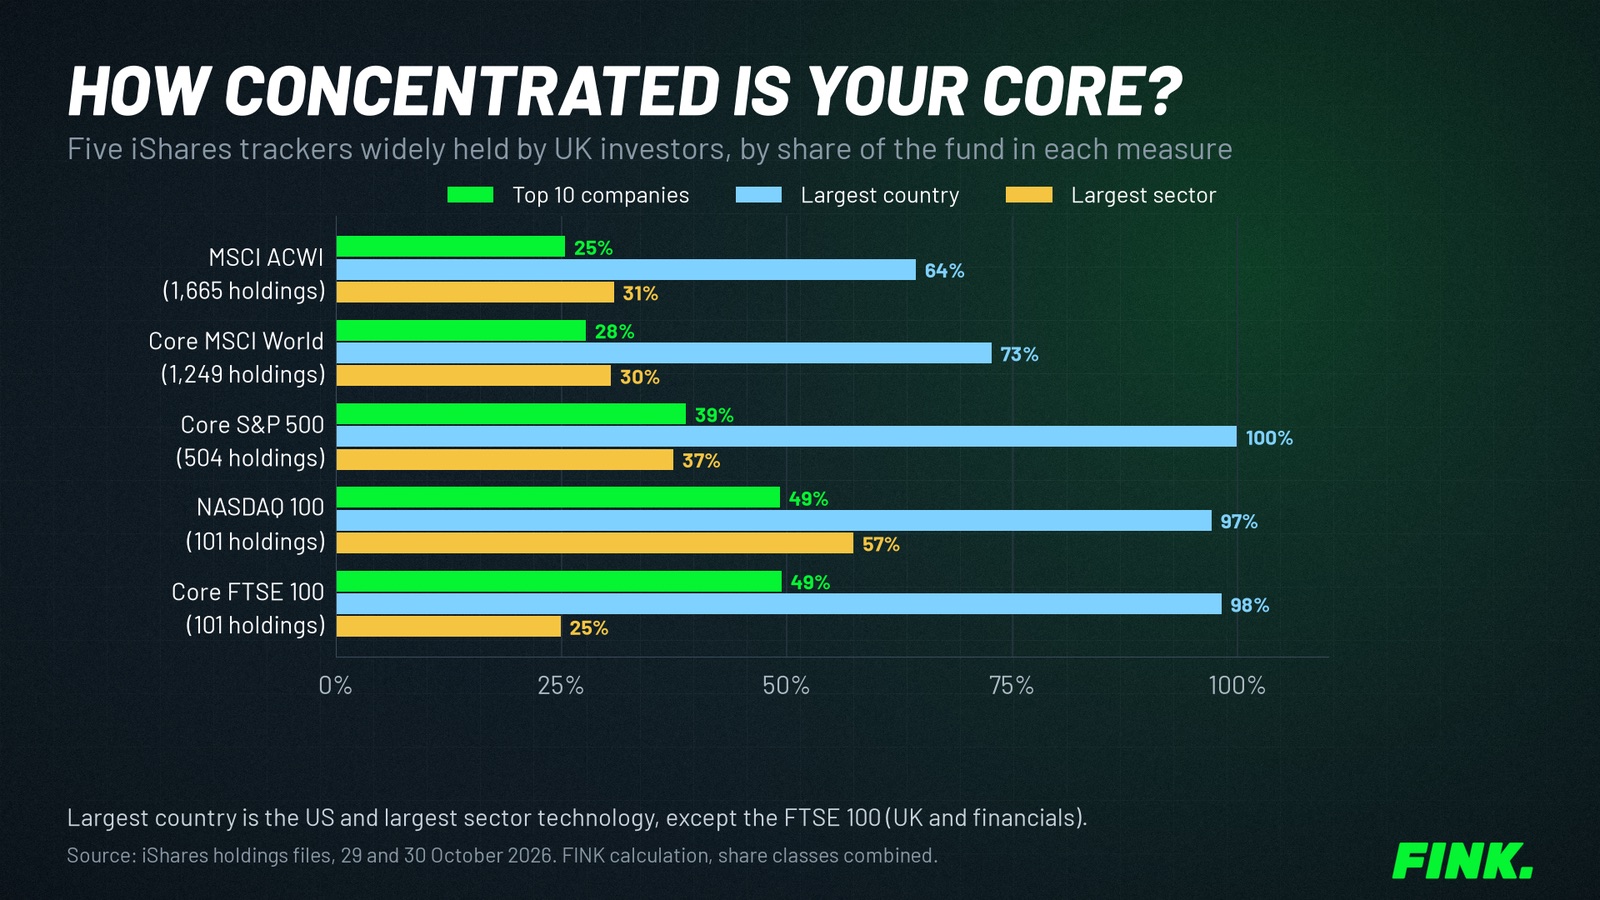
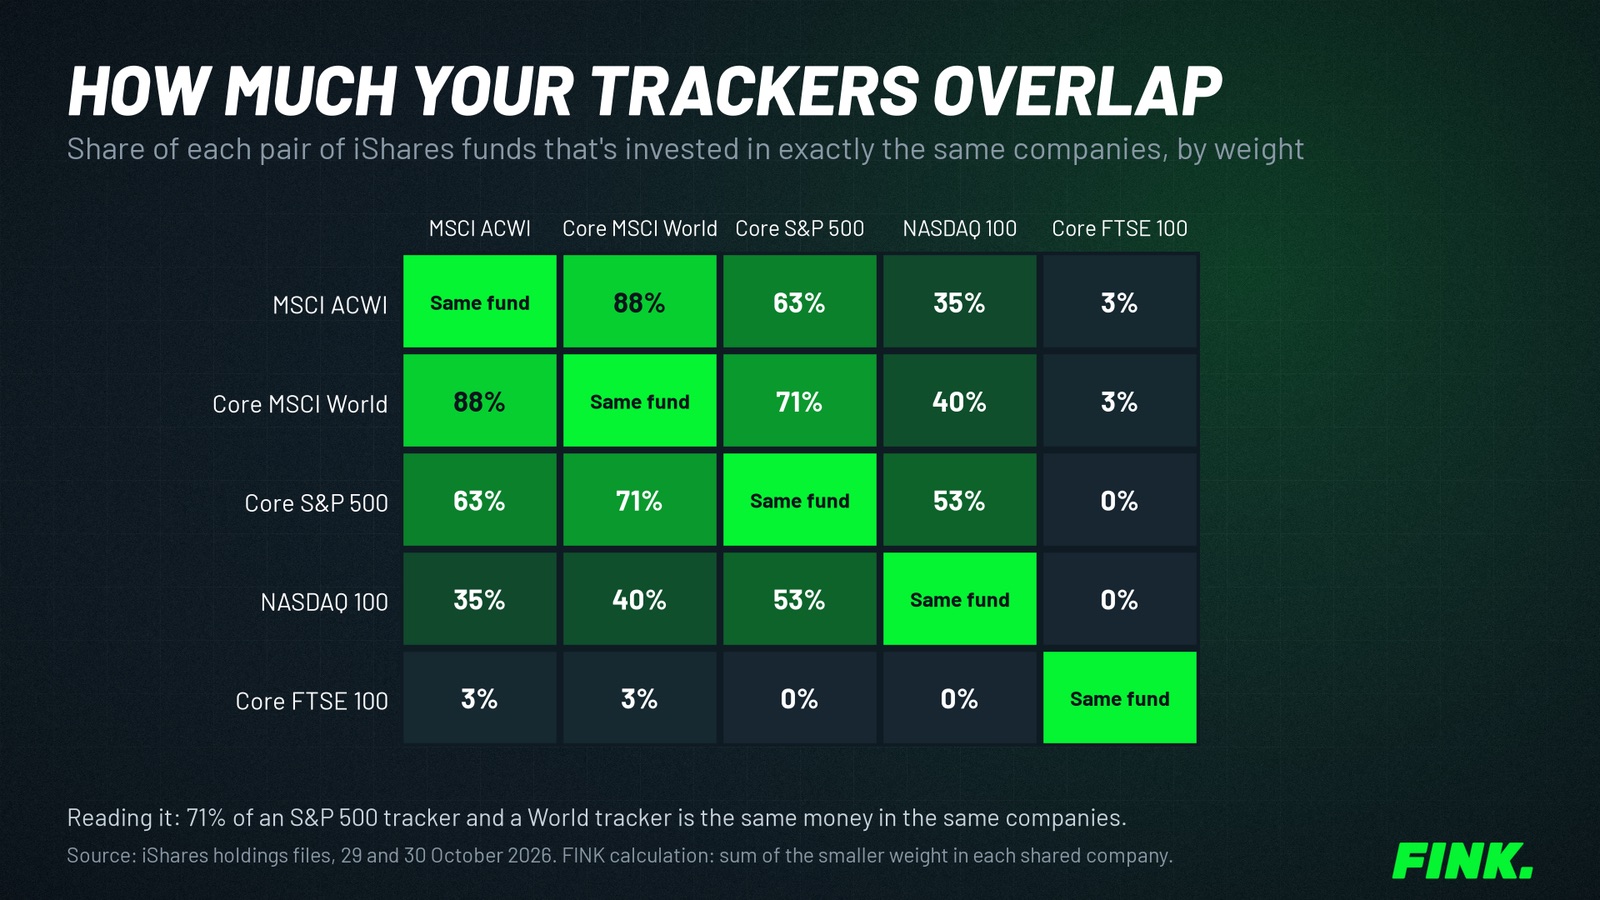
Probably more than your platform's holdings page shows. If you hold a global or US tracker as well as individual shares, the biggest US companies sit inside both.
We checked the published holdings files for two of the largest trackers sold to UK investors. On 29 October 2026, Apple was 5.61% of the iShares Core MSCI World UCITS ETF and Nvidia was 5.38%. On 30 October 2026, Apple was 7.70% of the iShares Core S&P 500 UCITS ETF and Nvidia 7.58%.
Here's how that adds up. Illustration only.
| Holding | Value | Apple inside it | Apple exposure |
|---|---|---|---|
| iShares Core MSCI World | £10,000 | 5.61% | £561 |
| Apple shares held directly | £2,000 | 100% | £2,000 |
| Rest of the ISA | £8,000 | 0% | £0 |
| Total ISA | £20,000 | £2,561 (12.8%) |
The platform shows a 10% Apple position. The real exposure is 12.8%, already above the usual UCITS single-company cap. Add an S&P 500 tracker on top and it climbs again. Our guide to fund overlap in an ISA shows how to run this check across your own funds.
How do I size positions inside an ISA with a £20,000 limit?
The allowance changes the maths in three ways: new money is limited, selling is tax-free inside the wrapper and small positions carry a relatively high dealing cost. All three push towards fewer, deliberately sized positions.
New money is your main rebalancing tool
The ISA allowance is £20,000 for 2026 to 2027, per GOV.UK. The Budget on 28 October 2026 confirmed the full £20,000 can still go into cash too (Budget 2026). Because you can't pour unlimited fresh money in, the allowance doubles as your rebalancing budget. Each year's contribution can be aimed at the holdings that are below their target, which is how you keep sizes in line without selling.
Selling inside the ISA is tax-free, losses are wasted
There's no capital gains tax when you trim inside a stocks and shares ISA, but losses can't be set against gains elsewhere either (LITRG). So trimming a winner inside an ISA costs only dealing charges and spread. Outside the ISA, the same trim may come with a tax bill. If you hold the same share in both, the ISA is usually the cheaper place to adjust size.
Small positions cost more to run
Dealing charges are a fixed amount per trade on most platforms, so they bite harder on small positions. Illustration only: say your platform charges £5 a trade. Buying and later selling a position costs £10 in total.
| Position | Round-trip dealing cost at £5 a trade | As % of the position |
|---|---|---|
| £250 | £10 | 4.0% |
| £500 | £10 | 2.0% |
| £1,000 | £10 | 1.0% |
| £2,000 | £10 | 0.5% |
Check your own platform's price list, because charges vary and many offer cheaper regular-investing trades. But the shape holds: very small positions in individual shares are expensive to build and to adjust.
A first-year illustration
Say you put £20,000 into a new ISA this tax year and want some individual shares around a tracker. These numbers illustrate the steps, not a recommended split.
- Decide the share portion first. Say £6,000 goes into individual shares and the rest into a broad fund.
- Decide how many companies you can actually follow. Say six.
- Equal weight in the share portion is £1,000 each, which is 5% of the £20,000 ISA.
- Start each at half (£500) while keeping the other £3,000 ready to bring proven ideas up to full size.
- Set a ceiling, say 10% of the ISA, as the point you'll stop adding and review.
- Check what the fund already owns of the same companies before buying.
The core and satellite guide goes further into splitting a tracker and individual shares inside one ISA.
What should a written sizing policy include?
Six lines, written before you buy, are enough for most private investors. The value is that they're decided while you're calm, not while a share is up 40% or down 30%.
- Risk budget per idea: the largest share of the whole portfolio I'll accept losing on one company.
- Starter size: how much goes in first.
- Full size: what has to be true before I add, written as evidence from the business, not the share price.
- Ceiling: the most one company can be, including what I own through funds.
- At the ceiling I will: redirect new money, stop reinvesting dividends, trim back or accept it on purpose.
- Review date: when I check sizes, for example once a year at the start of the tax year.
That list connects to the two other questions every holding needs answering: why you own it and what would make you sell. The investment thesis template covers the first. When to sell a stock covers the second. The stocks and shares ISA strategy guide shows where sizing sits in the wider process.
Common position-sizing mistakes
Most sizing problems aren't about picking the wrong number. They're about never picking one.
- Sizing by excitement. The biggest positions end up in the newest, most talked-about ideas rather than the best-understood ones.
- Ignoring fund exposure. Counting only direct holdings, as the Apple example shows.
- Letting drift decide. Never checking weights, so the portfolio's shape is set by past returns rather than by you.
- Averaging down without a ceiling. Adding to a falling share can turn a starter into the biggest holding without you noticing. Our guide to selling a stock at a loss covers when adding makes sense.
- Swinging big because the pot is small. Concentrating a small ISA in one or two shares to make it "matter" adds risk without fixing the real constraint, which is how much goes in. How much you need to be financially free runs the numbers on that.
- Tiny positions everywhere. Thirty holdings at 1% each, each costing a dealing charge and research time, while barely moving the total.
None of this needs software. A spreadsheet with each holding's value, its share of the total and what you own of it through funds will show you most of it in a few minutes.