
How much money do you need to be financially free in the UK?
A common rough guide is your yearly spending divided by a sustainable withdrawal rate. At 4% that's spending times 25. At 3.5% it's spending times about 28.6. The answer depends far more on what you spend than on anything you invest in.
The method in three steps
- Pick a spending figure. Use your own if you track it. Otherwise use an official benchmark, which is what we do below.
- Pick a withdrawal rate. This is the share of the starting pot you take in year one, then raise each year with inflation.
- Divide. Target pot = annual spending ÷ withdrawal rate.
Two details matter in the UK. Money drawn from a stocks and shares ISA isn't taxed, so an ISA withdrawal can be compared directly with after-tax spending. Pension income above the tax-free portion is taxed, so a pension pot has to be bigger to pay for the same spending.
What does it cost to live in the UK?
We used two official sources. Neither is perfect. They also measure different things.
ONS household spending. The Office for National Statistics found UK households spent an average of £676.60 a week in the year to March 2025. That's about £35,200 a year. It's an average across all household sizes and includes rent and mortgage interest but not mortgage capital repayments.
The Retirement Living Standards. Updated on 3 June 2026 by Pensions UK and calculated by Loughborough University's Centre for Research in Social Policy, these price three retirement lifestyles. They assume you own your home outright, so rent or a mortgage has to be added on top.
| Living standard | One person | Two people |
|---|---|---|
| Minimum | £13,900 | £22,500 |
| Moderate | £32,700 | £45,400 |
| Comfortable | £45,400 | £62,700 |
Source: Retirement Living Standards, annual spending after tax, outside London. London figures are higher.
The target pots
Here's what those spending levels imply if the whole amount has to come from investments, for example someone stopping work well before State Pension age. FINK calculation: spending ÷ withdrawal rate.
| Spending a year | Source | Pot at 4% | Pot at 3.5% |
|---|---|---|---|
| £13,900 | Minimum, one person | £347,500 | £397,100 |
| £32,700 | Moderate, one person | £817,500 | £934,300 |
| £35,200 | ONS average household | £879,600 | £1,005,200 |
| £45,400 | Comfortable, one person | £1,135,000 | £1,297,100 |
The State Pension changes this a lot later in life. The full new State Pension is £241.30 a week in 2026 to 2027, about £12,548 a year, according to Pensions UK.
Pensions UK then estimates the pension pot a one-person Moderate retirement needs on top. Assuming the full State Pension, no housing costs and a range of annuity prices, it's about £335,000 to £505,000. Its own estimate is that only 23% of the working population will reach the Moderate standard.
What's a safe withdrawal rate in the UK?
Recent UK studies cluster between about 3.7% and 4.1% for a 30-year retirement, depending on the method. The famous 4% figure comes from US data. Researchers have repeatedly found it's less comfortable outside the US.
The 4% rule comes from William Bengen's 1994 research on US stock and bond returns. Rathbones summarised the UK evidence in July 2026 and concluded that a more realistic UK rate is often 3.7% to 3.9%, before fees. It also points to retirement researcher Wade Pfau's finding, across 20 developed markets, that 4% would have been too aggressive in many of them, including the UK.
Morningstar's latest UK study, summarised by its director of personal finance Christine Benz in IFA Magazine in June 2026, used forward-looking return forecasts rather than history.
It ran 1,000 simulations per portfolio and defined success as at least 90% of them ending the 30 years with money left. The highest safe starting rate was 4.1% at 31 March 2026. It came from a portfolio with only 30% in shares.
Flexible approaches that cut spending after bad years allowed a starting rate of up to 5.7%.
What that means for this article:
- 4% is a reasonable round number for a rough target, but it isn't conservative for the UK.
- 3.5% gives a margin for fees, a longer retirement or a weak start.
- The rate assumes a 30-year horizon. Someone aiming to stop work at 40 needs their money to last longer, which pushes the safe rate down.
Can £10k on its own make you financially free?
Not on its own, on any growth rate that's reasonable to plan around. The numbers below are illustrations in today's money, not forecasts. They show what £10,000 becomes with nothing added.
| Illustrative real growth rate | After 10 years | After 20 years | After 30 years |
|---|---|---|---|
| 2% | £12,190 | £14,859 | £18,114 |
| 4% | £14,802 | £21,911 | £32,434 |
| 6% | £17,908 | £32,071 | £57,435 |
| 8% | £21,589 | £46,610 | £100,627 |
| 10% | £25,937 | £67,275 | £174,494 |
Method: £10,000 × (1 + rate) to the power of the number of years. No fees, no tax, no bad years. Real markets don't compound smoothly.
Even the top row, which assumes a rate few diversified portfolios have kept up for decades, ends with £174,494 after 30 years. At a 4% withdrawal rate that pays about £7,000 a year, roughly half the Minimum standard for one person.
Turn it around and the gap is clearer. For £10,000 to become £817,500 with no further money added, it would need to compound at:
- 55.3% every year for 10 years
- 24.6% every year for 20 years
- 15.8% every year for 30 years
Method: (target ÷ starting sum) to the power of 1 ÷ years, minus 1.
That's the core problem with the idea that the right stock can turn a small pot into freedom. It isn't impossible for one investment to grow that much. It's that planning on it means planning on an outcome most investments don't deliver.
Why chasing higher returns usually backfires on a small pot
Trying to grow a small sum fast tends to mean concentrating in a few volatile investments. The evidence on single stocks is sobering. A study and some arithmetic explain why.
Most single stocks disappoint
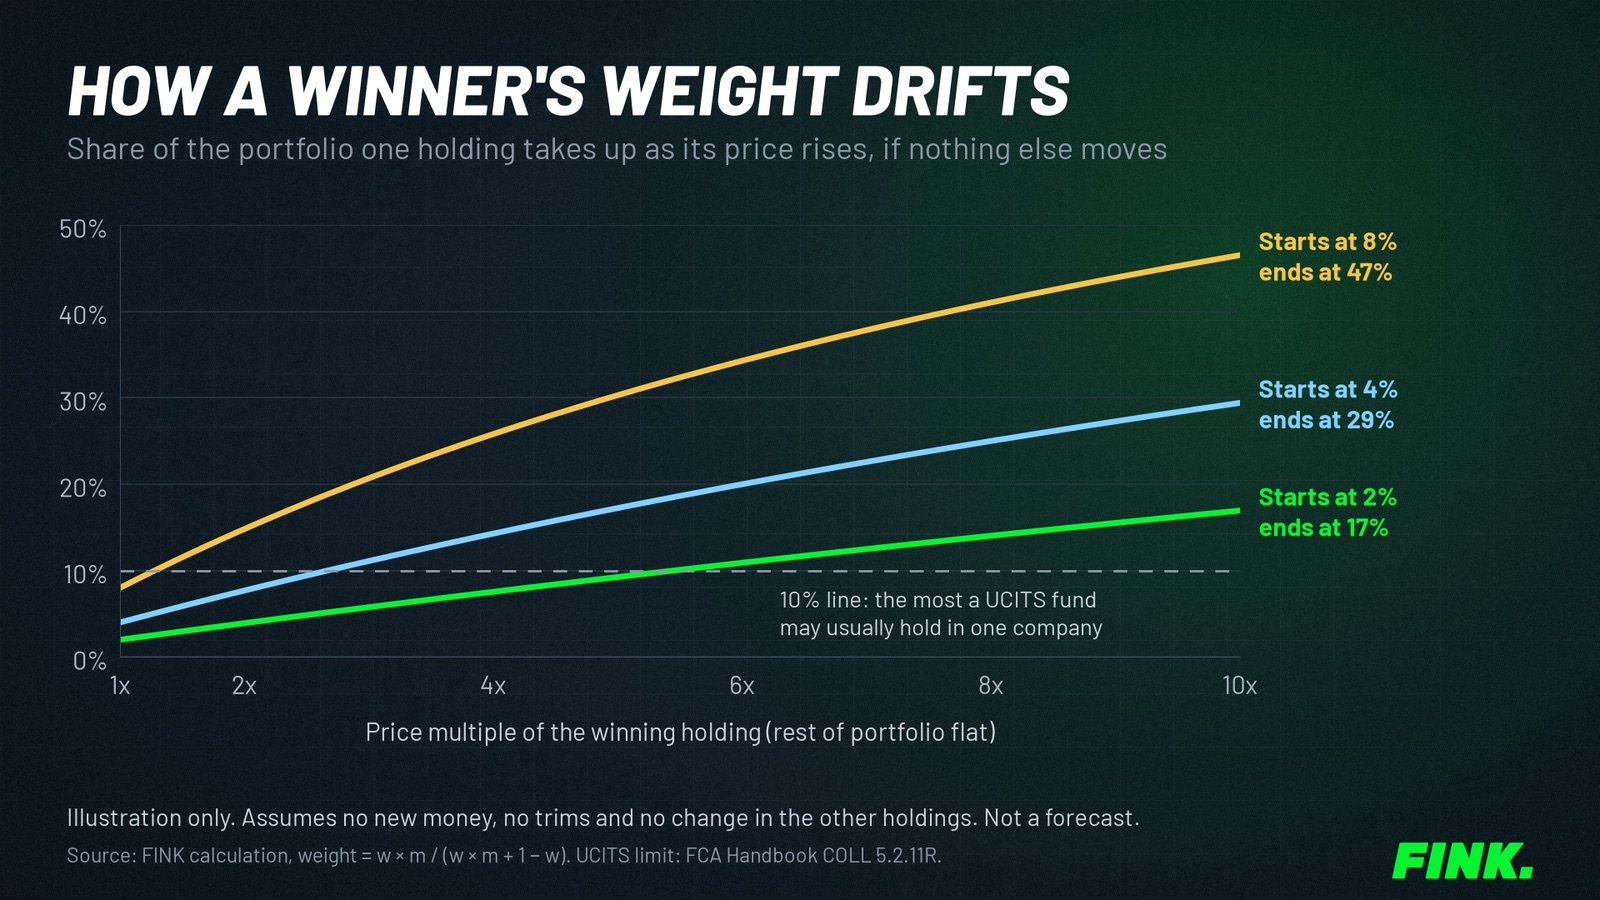
Hendrik Bessembinder's study of every US common stock from 1926 to 2016 found about 4% of companies accounted for all of the market's net wealth creation (Journal of Financial Economics, 2018). A small pot spread over two or three high-risk picks has a real chance of holding none of the 4%. Our position sizing guide sets out the rest of that study and what it means for how much rides on any one share.
Losses need bigger gains to recover
This is pure arithmetic. Any fall needs a larger rise to get back to where you started.
| Fall | Gain needed to get back to the start |
|---|---|
| 20% | 25% |
| 33% | 50% |
| 50% | 100% |
| 75% | 300% |
Method: gain needed = 1 ÷ (1 − fall) − 1.
When the plan depends on very high growth, one large fall can set it back years. Our guide to position sizing for one stock goes through how people size positions so a single mistake is less likely to do that.
Does saving more beat chasing higher returns?
In the early years, by a wide margin. The table compares a £10,000 starting sum with different monthly contributions and illustrative growth rates over 30 years.
| Monthly top-up | 2% | 4% | 6% | 8% |
|---|---|---|---|---|
| £0 | £18,100 | £32,400 | £57,400 | £100,600 |
| £250 | £140,900 | £203,800 | £301,100 | £452,800 |
| £500 | £263,700 | £375,100 | £544,700 | £804,900 |
| £1,000 | £509,400 | £717,700 | £1,031,900 | £1,509,200 |
| £1,667 (full ISA allowance) | £837,000 | £1,174,800 | £1,681,900 | £2,448,700 |
Method: £10,000 at the start plus the monthly sum at each month end, growing at the monthly equivalent of the rate shown, rounded to the nearest £100. All rates are illustrations in today's money. No fees or tax. £1,667 a month is roughly the £20,000 annual ISA allowance.
Read the table across and then down:
- Going from 2% to 8% growth on £10,000 alone adds about £82,500 after 30 years.
- Adding £500 a month at just 2% gives £263,700, more than £10,000 alone would reach at 10%.
- Doubling contributions from £500 to £1,000 a month adds more than raising the growth rate from 4% to 6% does at either contribution level.
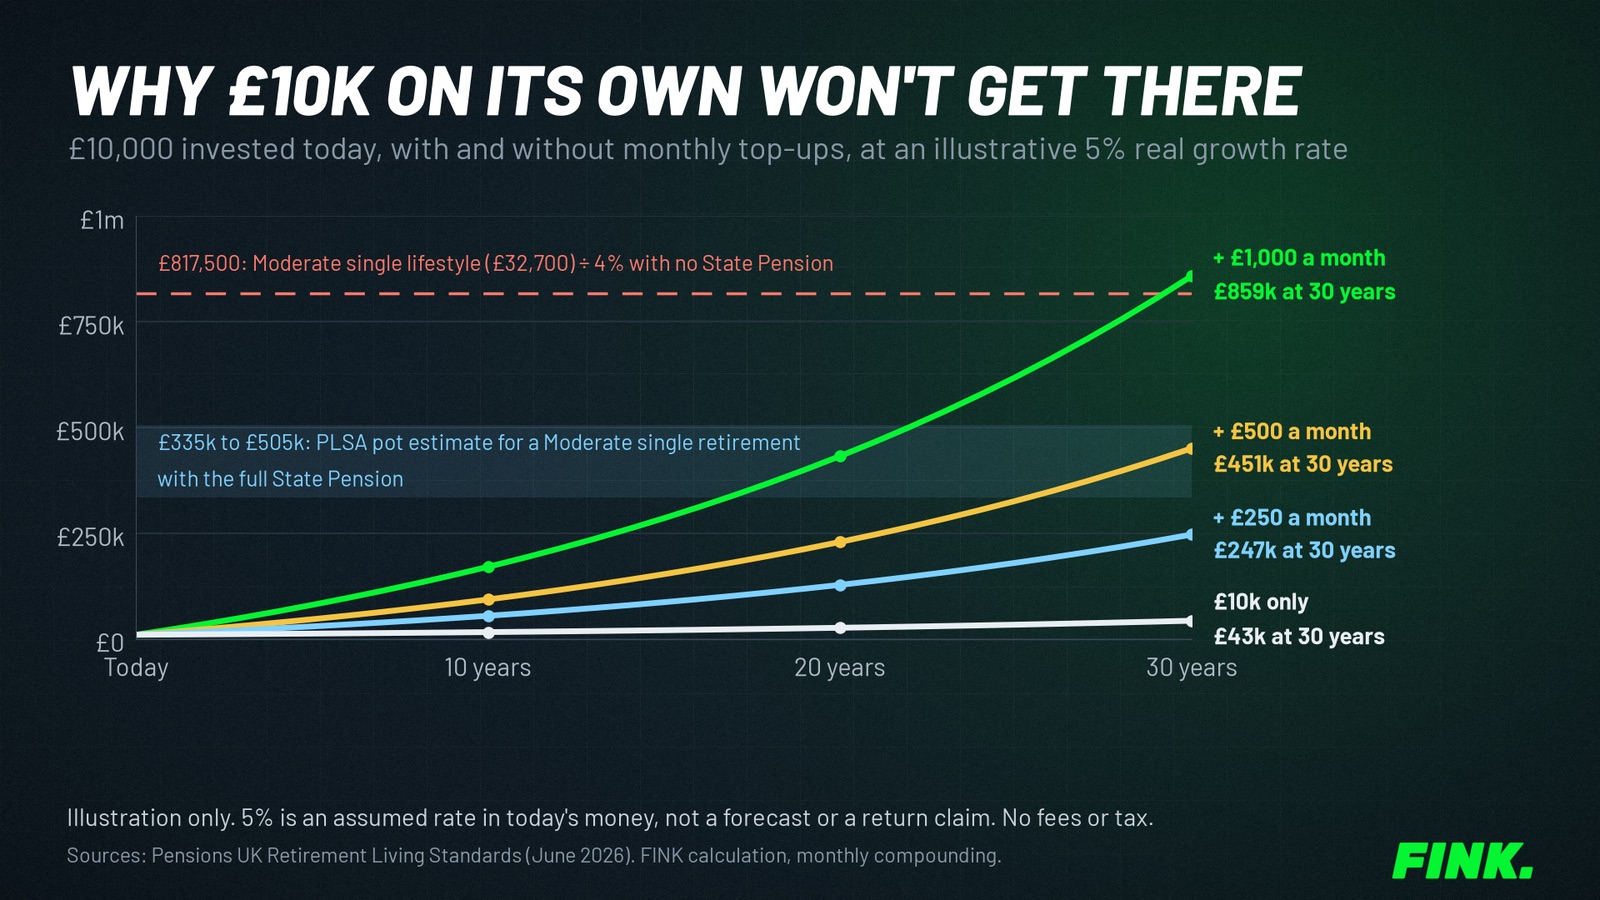
The chart shows the same idea over time at a single illustrative rate of 5%, with the two targets from earlier.
Why contributions dominate at the start
Growth is a percentage of what's already invested. On a £10,000 pot, a strong year of 10% adds £1,000. Saving £500 a month adds £6,000 in the same year whatever the market does.
The balance tips the other way only once the pot is large. At £250,000, a 5% year adds £12,500, more than two years of £500 a month.
There's a trade-off.
Saving more means spending less now. Not everyone can.
Professor Matt Padley of Loughborough University, who leads the research behind the living standards, put it plainly in the June 2026 release: "you can't save money you don't have". The arithmetic doesn't change that. It just shows which lever moves the result most when you do have a choice.
How much do I need to invest to live off dividends in the UK?
Using a 3.3% yield, covering £32,700 of spending purely from dividends would take a portfolio of about £990,900. That's more than the 4% withdrawal method, because the yield is lower than 4%.
The 3.3% figure is AJ Bell's consensus forecast for the FTSE 100's dividend yield in 2026, published on 8 October 2026. At that yield:
| Annual income wanted | Portfolio needed at 3.3% yield |
|---|---|
| £13,900 (Minimum, one person) | £421,200 |
| £32,700 (Moderate, one person) | £990,900 |
| £45,400 (Comfortable, one person) | £1,375,800 |
Method: income ÷ 0.033. Dividends can be cut or cancelled.
Living only off dividends has an appeal because you never sell.
The trade-off is that it ties your income to a narrower set of higher-yielding companies.
Research on withdrawal rates generally uses total return, meaning dividends plus selling some holdings. Inside an ISA, dividends are tax-free. Outside it, the dividend allowance is £500 and rates rise to 10.75%, 35.75% and 39.35% in 2026 to 2027, according to GOV.UK. Our guide to stocks and shares ISA dividends covers the detail.
How do UK savers actually compare?
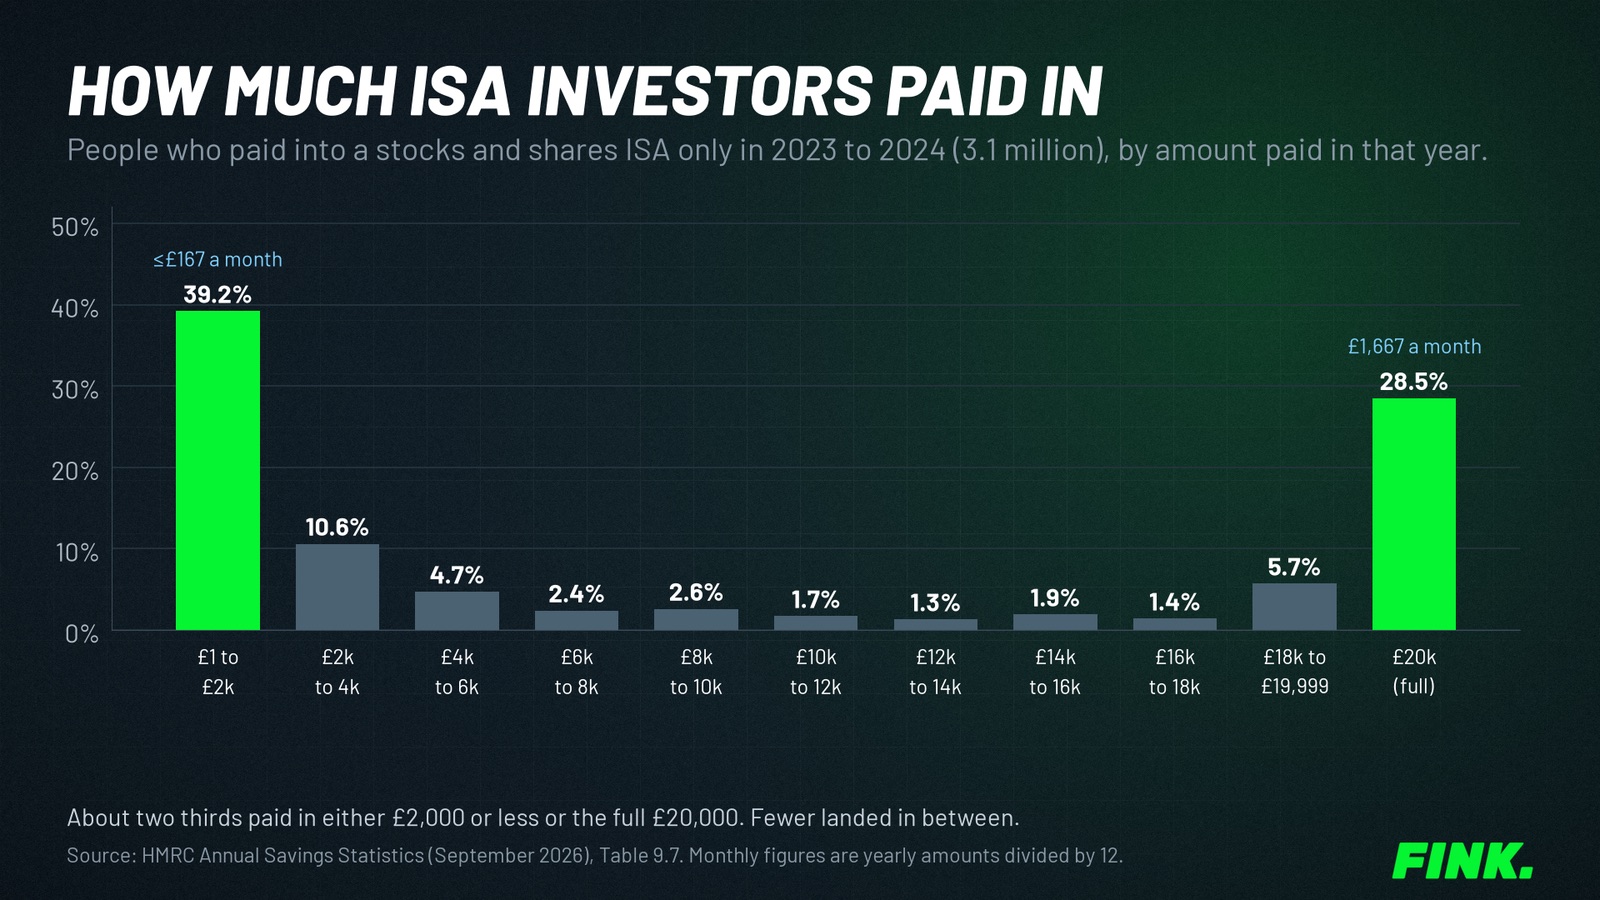
Most ISA holders are a long way from these targets, which is normal, not a failure. HMRC's latest Annual Savings Statistics show the average ISA holding was £37,831 in 2023 to 2024. Of those who paid in that year, 28.8% used their full allowance and 30.7% put in £2,000 or less, according to HMRC Table 9.7.
The biggest pots took decades. HMRC data released to Plum under freedom of information showed 7,730 ISA millionaires at 5 April 2024 out of more than 23 million ISA holders. Our ISA millionaires guide looks at what the published data says about them.
What actually moves the number at the start?
Capital size and savings rate first, costs and risk control second, investment selection third. That ordering isn't an opinion about stock picking. It's what the arithmetic above shows when the pot is small.
At FINK we look at it this way: in the early years your job is mostly to build the pot and avoid the big loss that takes years to recover. Picking well matters more as the pot grows, because each percentage point is worth more pounds.
A practical order of work:
- Know your number. Track your spending for a few months and divide by 0.035 or 0.04.
- Set a savings rate you can keep up. Consistency matters more than an ambitious figure you'll abandon.
- Use the tax wrappers. Many people start with the £20,000 ISA allowance because it's flexible. Where an employer matches pension contributions, the pension can come out ahead. Our monthly ISA guide runs through monthly amounts.
- Keep costs low. A fee comes off every pound, every year, whatever markets do.
- Size risk so no single idea can sink the plan. The core and satellite approach is one common way people separate a steady base from higher-risk ideas.
- Review once a year. Recalculate the target and the gap. Our stocks and shares ISA strategy guide sets out a full annual process.