


How many shares do you need to be diversified?
Somewhere between ten and a few hundred, depending on which study you read and what you mean by diversified. The research agrees on the shape of the answer, which is that the first ten to twenty shares do most of the work, but not on the exact number.
That spread is why answers online vary so much. A This is Money panel of three investment professionals gave six, 12 and "a few dozen". None of them was wrong. They were answering slightly different questions.
Below is what the main studies found and why the number has gone up over time. Then the factor the studies leave out, which is your own time.
What does the research say?
The classic studies measured how the volatility of a portfolio falls as you add randomly chosen shares. Their conclusions range from about ten shares to more than 100.
| Study | Data | Conclusion |
|---|---|---|
| Evans and Archer (1968) | US shares | Little extra benefit beyond 8 to 10 shares |
| Statman (1987) | Elton and Gruber's US data | At least 30 shares for a borrowing investor and 40 for a lending investor |
| Campbell, Lettau, Malkiel and Xu (2001) | US shares, 1962 to 1997 | About 50 shares needed by 1986 to 1997 for the diversification 20 gave earlier |
| Zaimovic, Omanovic and Arnaut-Berilo (2021) | Review of 150 publications, 1952 to 2021 | No general optimal number. Recent studies suggest 30 to 50, some 100 or more |
Sources: Statman, NBER summary of Campbell and others, Journal of Risk and Financial Management review. Evans and Archer's result is as summarised in Statman and the 2021 review.
What the diversification curve looks like
Statman's Table 1 shows the expected annual standard deviation (a measure of how much returns swing) for equally weighted portfolios of different sizes. We've charted it below.
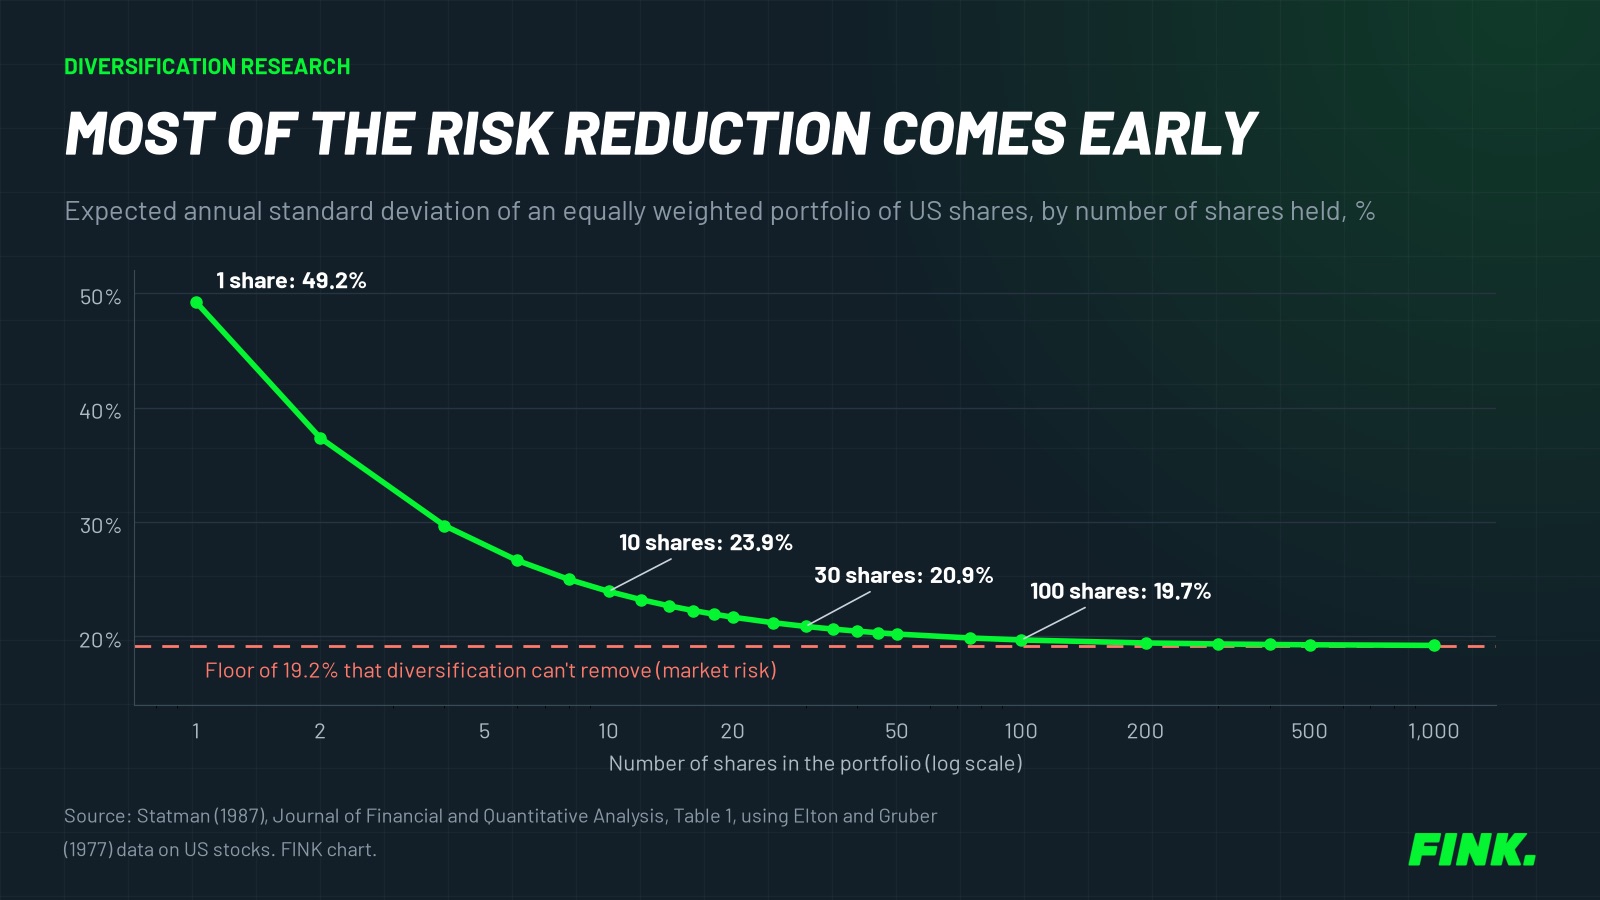
A few points from the table:
- One share: 49.2%.
- Ten shares: 23.9%, about half the single-share figure.
- Thirty shares: 20.9%.
- One hundred shares: 19.7%.
- The floor, with every share in the market: 19.2%.
The floor is market risk. It's the part that moves with the whole market and you can't diversify it away, however many shares you hold.
Why did the number go up?
Because individual companies became more volatile relative to the market. Campbell, Lettau, Malkiel and Xu found that company-specific volatility rose markedly between 1962 and 1997 while market volatility didn't trend up. The NBER's summary of the paper says that by 1986 to 1997, about 50 shares were needed to reach the level of diversification that about 20 had provided in the earlier decades (NBER).
The 2021 review in the Journal of Risk and Financial Management brings the picture up to date. It concludes that a general optimal number "does not exist for whichever market, period or investor". Results depend on the market, the period, how risk is measured and the investor. Portfolios built to diversify extreme losses come out larger than those built on standard deviation. The review also notes the counter-evidence: a large share of company-specific risk can be removed with a small portfolio. The case for very large portfolios is weaker once trading costs are counted.
How many shares do individual investors actually hold?
Far fewer than any of those studies suggest. In Goetzmann and Kumar's study of 62,387 investors at a large US discount broker from 1991 to 1996, the average portfolio held four shares and the median three. Fewer than 5% held more than ten.
The same paper found under-diversification was more common among younger, lower-income and less experienced investors. It also found it was linked to behaviour consistent with overconfidence and trend-following. It found little evidence that small portfolio sizes or trading costs were the reason.
There's a counter-point in the same research. A small group of investors who held concentrated portfolios did well, which the authors linked to better information. Concentration isn't automatically a mistake. It's a bet that you know something the market doesn't. The evidence suggests most people who make that bet aren't in that group.
Does it matter if you also hold funds?
Yes, a lot. Most of the research assumes the shares are your whole portfolio. If a global or UK index fund is the core of your ISA, the fund already does the diversifying. Individual shares on top are then a question of how much each could move the total, not of diversification from scratch.
Two things to check:
- Do your shares duplicate the fund? The ten largest companies made up 24.5% of one global tracker we checked on 29 October 2026. Buying those shares directly adds to positions the fund already gives you. Our how many funds guide has the detail.
- How large are the shares in total? Ten shares that make up 10% of an ISA are a very different risk from ten shares that make up 90% of it.
That second point is about sizing. We cover the principles, without prescribing a number, in how much to invest in one stock.
How many companies can you actually follow?
This is the limit the studies don't measure. Diversification research picks shares at random and holds them. Real investors pick shares for reasons. Those reasons need checking when companies report. The number of companies you can keep up with is a real cap.
One simple measure is the number of reporting events. UK-listed companies on the main market must publish an annual financial report within four months of their year end and a half-yearly report within three months of the half year (FCA Handbook DTR 4.1 and DTR 4.2). US-listed companies file an annual 10-K plus a 10-Q for each of the other three quarters (Investor.gov). Many also publish trading updates on top.
The holdings you can follow worksheet
Fill this in for the shares you hold or plan to hold. The numbers in brackets are an illustration of the method, not a recommendation.
| Step | What to write down | Illustration |
|---|---|---|
| 1 | Number of UK-listed shares | (12) |
| 2 | Results releases a year for those, at two each | (24) |
| 3 | Number of US-listed shares | (6) |
| 4 | Results releases a year for those, at four each | (24) |
| 5 | Total results releases a year | (48) |
| 6 | Your honest time per release, including reading the statement and checking your reason for owning it | (Your number) |
| 7 | Total hours a year, step 5 times step 6 | (Your number) |
| 8 | Hours a year you'll really give it | (Your number) |
In the illustration, 18 shares produce 48 results announcements a year, nearly one a week. If step 7 is bigger than step 8, you hold more shares than you can follow. The options are fewer shares, more of the ISA in funds or accepting that some holdings won't be checked, which defeats the point of picking them.
So what's a sensible number?
There isn't one number that suits everyone, but the evidence narrows it down:
- If individual shares are your whole ISA, the research points to at least 20 to 30 and probably more, spread across sectors and countries, to get most of the available diversification.
- If a fund is your core, the count of individual shares matters less than their combined size and whether they duplicate the fund.
- Either way, the worksheet sets the upper limit. A share you can't follow is a share you're holding on hope.
At FINK we look at it this way: the right number is the smallest one that gives you the diversification you need and the largest one you'll actually keep up with. For a lot of people, those two numbers don't meet. That's the strongest argument for a fund core. Our shares or funds guide takes that decision further. The ISA strategy guide sets it in a full process.