

Why is selling harder than buying?
The short answer is attention. Buying feels like research. Selling usually happens under pressure, after a big move or a scary headline. The evidence suggests that's when people decide worst.
The clearest data comes from professionals, which makes it harder to wave away. Klakow Akepanidtaworn, Rick Di Mascio, Alex Imas and Lawrence Schmidt studied 783 institutional portfolios averaging about $573 million, with 4.4 million trades between 2000 and 2016 (Journal of Finance, 2023).
Their buys outperformed a strategy of randomly adding to existing holdings by more than 100 basis points a year. Their sells did the opposite. In the authors' preferred measure, the managers gave up about 80 basis points a year compared with simply selling a different holding at random.
Two details from that paper matter for anyone running their own money:
- Extremes get sold. The best and worst performers in a portfolio were sold at rates more than 50% higher than holdings with less striking recent returns (NBER working paper, p. 4). The authors read this as a shortcut: sell whatever stands out, rather than whatever's weakest on the facts.
- Attention fixes a lot of it. Sells made on company earnings days, when the managers were forced to look at the business, outperformed sells on other days by more than 150 basis points a year. The authors' conclusion is that the skill exists. It just isn't being applied when selling.
Private investors show a related pattern. Terrance Odean looked at 10,000 accounts at a US discount broker between 1987 and 1993. Investors were far more willing to sell shares that were up than shares that were down (Journal of Finance, 1998). That habit has a name, the disposition effect, from Hersh Shefrin and Meir Statman's 1985 paper.
The cost showed up afterwards. Over the following year, the winners people sold outperformed the losers they kept by 3.41 percentage points on average.
Then there's the cost of acting at all. Brad Barber and Odean found the US households that traded most lagged the market badly after costs, though they did about as well before them (Journal of Finance, 2000).
Dealing costs are far lower now, so the size of that gap wouldn't repeat today. The direction of the finding (more decisions, more chances to get one wrong) still stands. We look at the study in more detail in individual shares or funds in your ISA.
| Study | Who | What it found about selling |
|---|---|---|
| Odean (1998) | 10,000 US broker accounts, 1987 to 1993 | Investors sold winners more readily than losers. Sold winners beat kept losers by 3.41 points over the next year |
| Barber and Odean (2000) | 66,465 US households, 1991 to 1996 | The most active traders lagged after costs. Gross results were similar to the market |
| Akepanidtaworn et al. (2023) | 783 institutional portfolios, 2000 to 2016 | Sells trailed random selling by about 80bps a year. Buys added more than 100bps |
| Akepanidtaworn et al. (2023) | Same data, earnings days only | Sells made when attention was on the business did more than 150bps a year better |
These studies are mostly American and the oldest is nearly 40 years old. None of them tells you when to sell a particular share. What they do show, fairly consistently, is that selling on impulse has a cost and that a deliberate process tends to narrow it.
Should you sell winners or hold them?
The evidence points both ways, which is why a blanket rule in either direction is risky.
The case for holding winners is strong at the level of the whole market. Hendrik Bessembinder studied every US common stock from 1926 to 2016. The best-performing 4% of companies accounted for all of the net wealth the US market created over Treasury bills (Journal of Financial Economics, 2018). If gains are that concentrated, selling a winner early can cost far more than a single bad buy. We set out the rest of his numbers and what they mean for how big one holding should be in how much to invest in one stock.
Momentum research points the same way over months, though the picture flips over three to five years. Both findings and what they mean for a share that's fallen are in our guide to selling a stock at a loss. For the winners' side, including how much to trim, see when to take profits on long-term stocks.
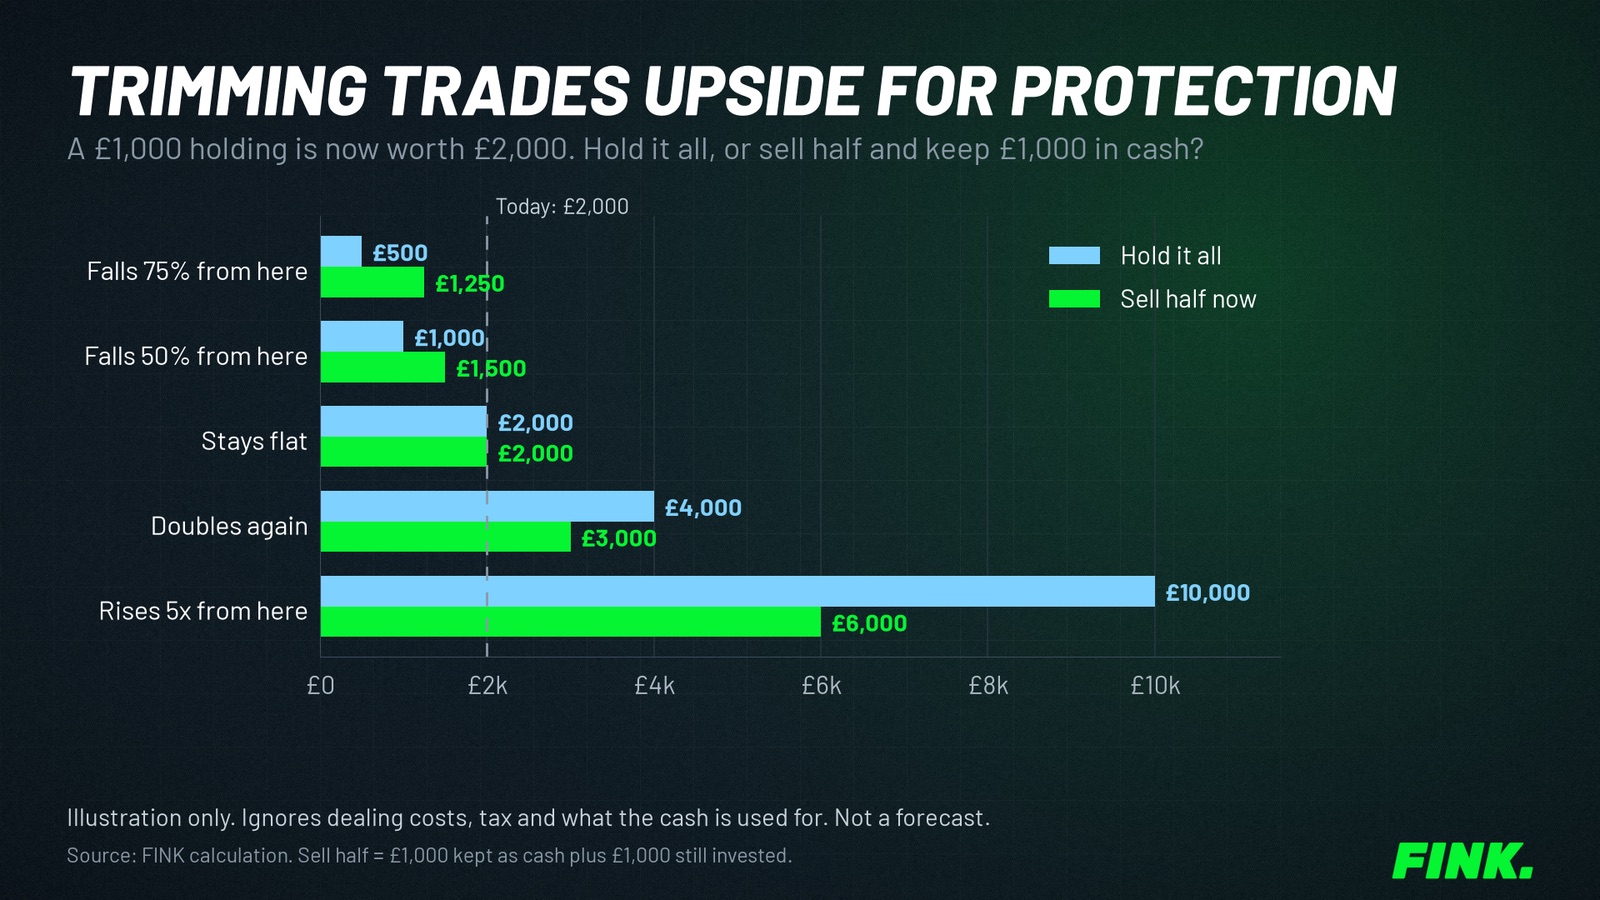
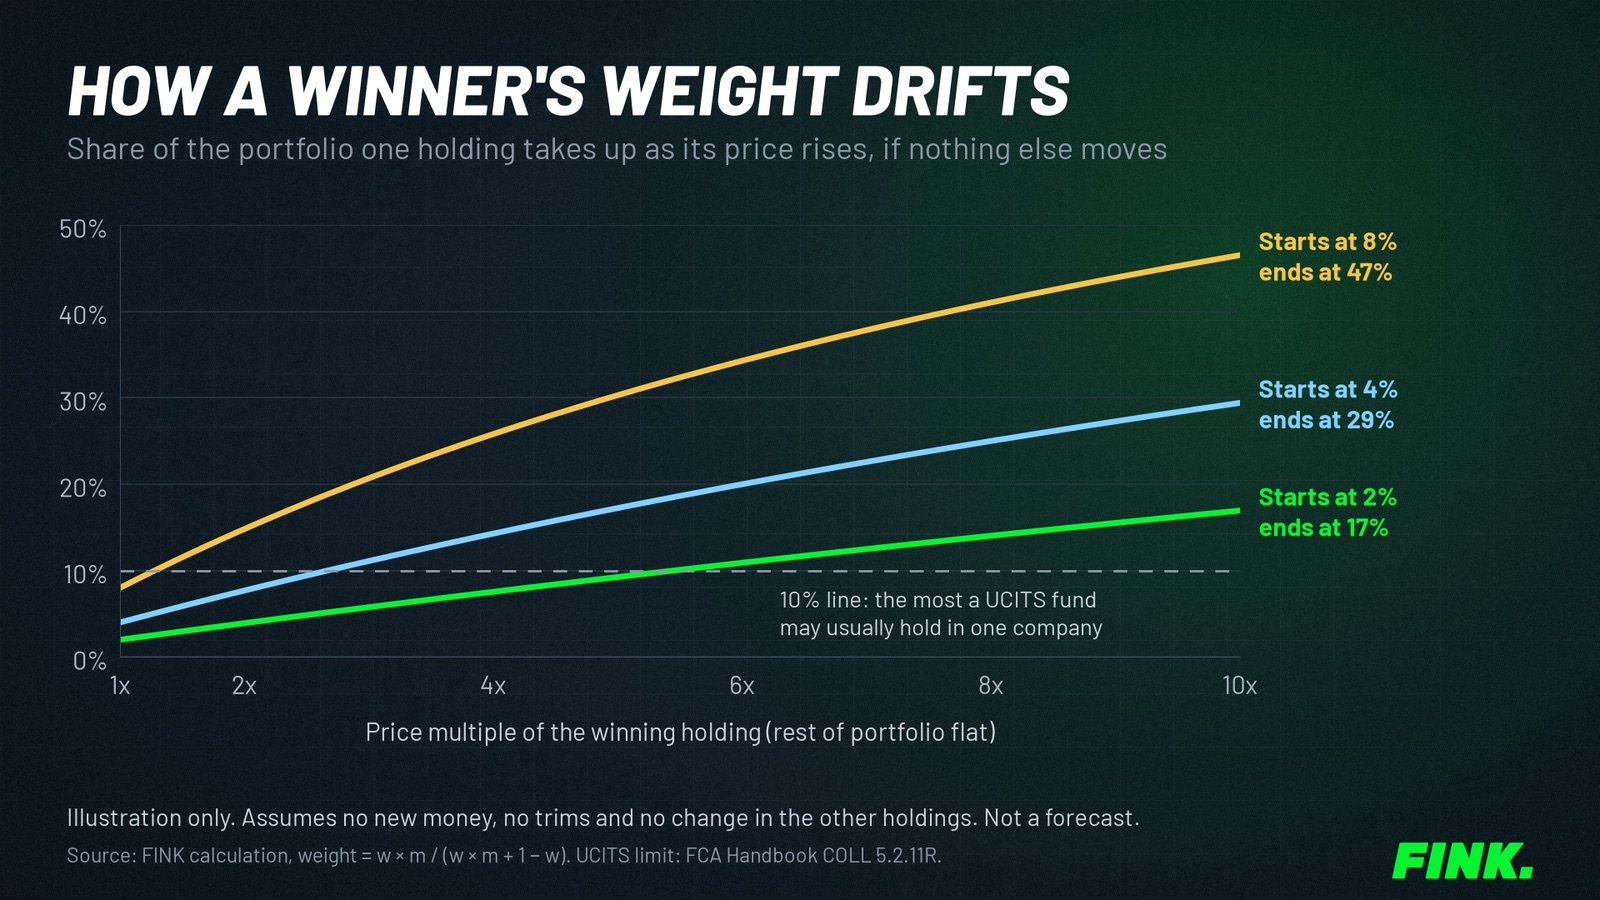
The case for trimming is about risk, not returns. A share that triples while the rest of your holdings stand still can end up dominating your results. The same data that shows a few huge winners also shows that more than half of individual stocks lost money over their lifetimes.
Concentration works brilliantly when you've picked one of the 4%. It doesn't when you haven't. You won't know which until afterwards.
So the question isn't really "winner or loser". It's whether the position still fits the size and the reasons you set when you bought it. That's where a decision tree helps.
What are good reasons to sell a stock?
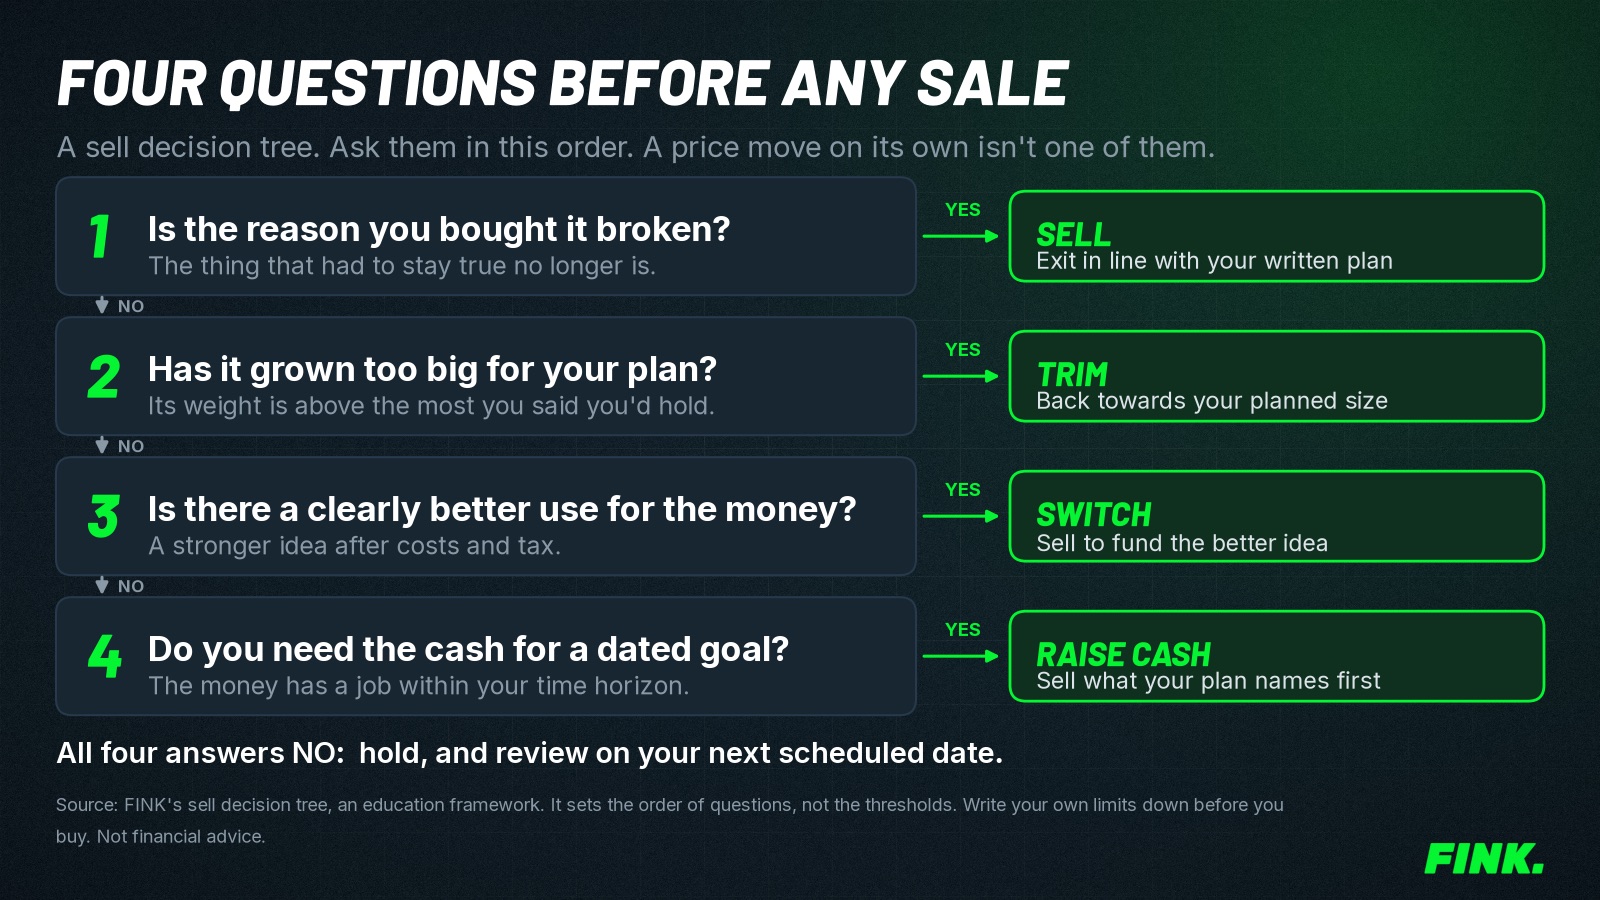
Four reasons hold up across the research and the professional literature. They're shown in the chart above in the order we suggest asking them. At FINK we treat the order as part of the method, because the first question that gets a yes decides what kind of sale you're making.
- The thesis has broken. You bought for a reason. The thing that had to stay true no longer is. A lost contract that was most of the revenue, a dividend cut you'd said would end the case, a balance sheet that's changed shape. This is a full exit, because nothing's left of the original idea.
- It's grown too big for your plan. The business might be fine. The position has simply become a bigger share of your money than you said you'd hold. This calls for a trim back towards your planned size, not a full sale. There's more on setting that size in our guide to how much to invest in one stock.
- There's a clearly better use for the money. A stronger idea exists. It's still stronger after dealing costs, spreads and any tax on the sale. This is a switch. The word clearly matters here, because a vague hunch about a new share is how the Barber and Odean households ran up their costs.
- You need the cash for a dated goal. A house deposit, school fees, a tax bill. The money has a job inside your time horizon. This is a cash raise. It works best when your plan names in advance which holdings go first.
If all four answers are no, the default is to hold and look again on your next scheduled review date. That default matters as much as the questions. It's what stops a sharp move from becoming a decision by itself.
How do you know if a thesis has broken?
You can only tell if it was written down to begin with. A thesis that lives in your head will drift to fit whatever the share does next.
A useful thesis has three parts. Why you think the business is worth more than the price, what has to stay true for that to hold and what would prove you wrong. The third part is the sell trigger. Our investment thesis template walks through it with a worked example.
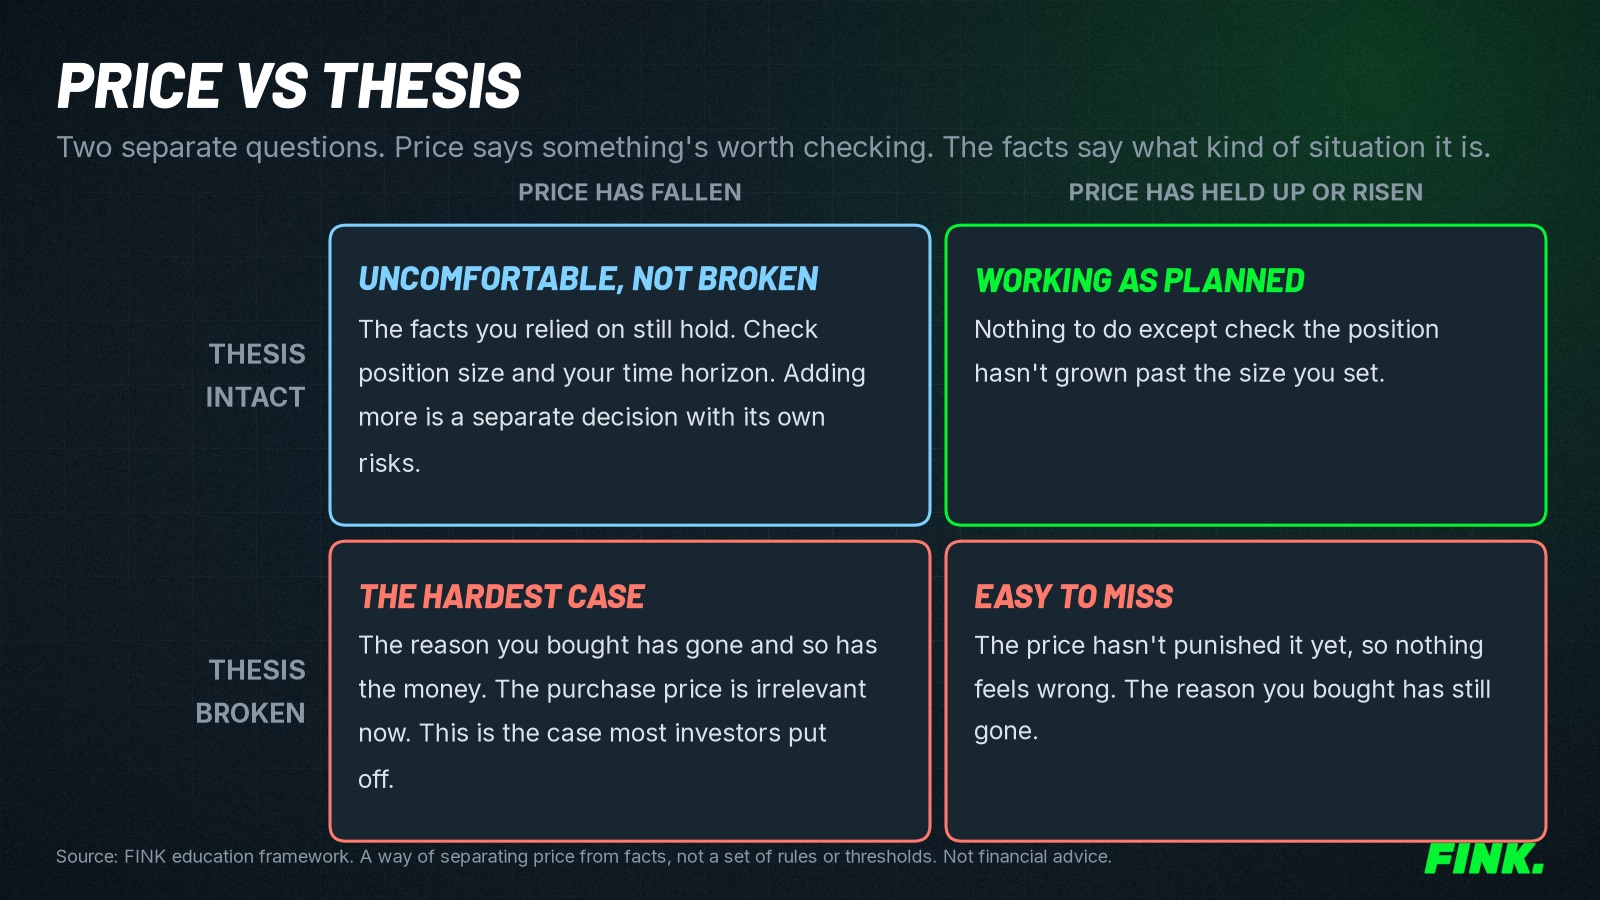
The test is about facts, not price. A share can halve while the thesis stays intact. A share can also rise while the thesis falls apart underneath it. If the reason you bought is still true, a falling price is something to check, not a verdict.
Is a high valuation a reason to sell?
It can be part of the case, but the evidence says valuation is a poor timing tool over short horizons. Vanguard tested a range of common market measures against US returns back to 1926 (Vanguard, 2012). Price/earnings ratios had almost no ability to forecast the following year's returns. Over 10 years they explained only about 40% of the variation, which leaves around 60% unexplained.
That research is about the whole market, not single shares, so treat it as a caution rather than a rule. A share trading on a demanding valuation is a reasonable prompt to recheck your thesis. It isn't, on its own, strong evidence that the price is about to fall.
Should you sell a stock that's fallen?
Not because it's fallen. Go through the same four questions. Ask the first one harder than usual.
The trap is the purchase price. It feels important, but the market doesn't know what you paid.
Psychologists call this anchoring. Odean's data suggests it's the reason losers get held. Selling turns a paper loss into a real one, so people wait to get back to even.
One test some investors use is to ask whether they'd buy the share today, at today's price and at its current size, if they didn't already own it. It's a decent prompt because it removes the purchase price from the question.
It has limits. A yes doesn't account for dealing costs or tax on switching. A no can be driven by the same fear that's making you want to sell. Use it to check your reasoning, not to replace it.
There's also the opposite mistake. Selling every share that drops a set amount can lock in losses on good businesses during broad market falls, when almost everything is down together. We cover the trade-offs in more depth in when to sell a stock at a loss. The ISA side is in what to do if your stocks and shares ISA is losing money.
Do stop-losses work?
They can, but the evidence depends heavily on how prices behave. Kathryn Kaminski and Andrew Lo built a framework to measure whether a stop-loss adds or subtracts value (Journal of Financial Markets, 2014).
Their result has two halves. If prices follow a random walk, a stop-loss always lowers expected returns, because it forces you out of a rising asset at random moments. If prices show momentum, a stop-loss can add value.
Testing US stock and bond futures from 1993 to 2011, they found that some stop-loss rules, checked monthly, raised returns and cut volatility. Their example showed returns up 1.5 percentage points and volatility down 5 points in one calibration.
That's evidence for the idea of a pre-set exit, not for any particular level. The practical trade-offs for a private investor are well known:
| Approach | What it helps with | What it costs |
|---|---|---|
| Hard stop-loss order with your broker | Takes emotion out at the moment of sale | Can trigger on a brief dip and fill below your level if the price gaps |
| Mental stop, checked on a schedule | Fewer whipsaws from intraday noise | Easier to ignore when the moment arrives |
| No price exit, thesis review only | Avoids selling good businesses in broad falls | Losses can grow while you wait for the facts to change |
None of these is right for everyone. What matters is that the method is chosen before the position is opened and that it fits how often you're realistically going to look.
How does tax change when to sell?
Inside a stocks and shares ISA, it doesn't. You pay no Capital Gains Tax on gains in an ISA (gov.uk). Outside one, in a general investment account (GIA), tax can make a sale noticeably more expensive. That belongs in question three.
The 2026/27 numbers from gov.uk are:
- Annual exempt amount: £3,000 of gains a year tax-free (gov.uk).
- Rates on shares: 18% on gains that fall within your basic-rate band and 24% above it (gov.uk).
The chart below shows what that means for a single sale.
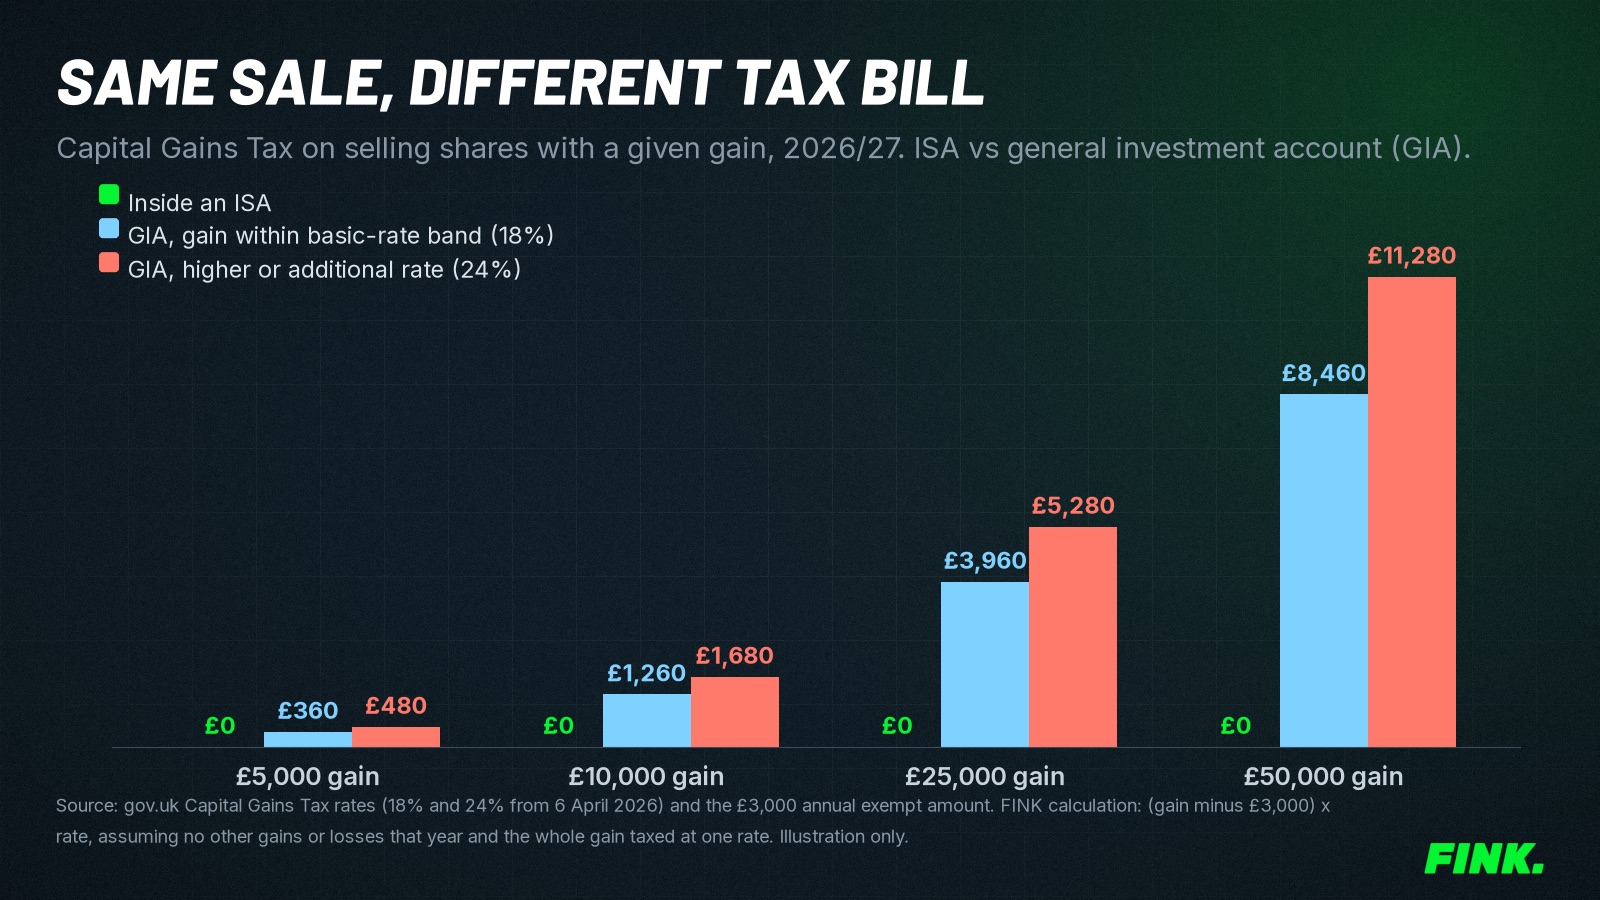 Source: gov.uk Capital Gains Tax rates and allowances, 2026/27. FINK calculation.
How we worked it out. Tax = (gain minus the £3,000 annual exempt amount) x the rate. So a £10,000 gain gives £7,000 taxable, which is £1,260 at 18% or £1,680 at 24%. This assumes no other gains or losses in the tax year and that the whole gain is taxed at one rate.
In real life, part of a gain can fall in the basic-rate band and part above it. Losses on other GIA holdings can be set against it. It's an illustration of the scale, not a tax calculation for you.
| Stocks and shares ISA | General investment account | |
|---|---|---|
| Tax on gains when you sell | None | 18% or 24% above the £3,000 allowance |
| Losses | Can't be used against gains elsewhere (gov.uk) | Can be set against gains |
| Tax on dividends | None | Above the £500 dividend allowance (gov.uk) |
| Buying back within 30 days | No tax effect | Matched to the new shares under the 30-day rule (HS284) |
| Selling part of a holding | No calculation needed | Cost is the average of your pool (the Section 104 holding) |
Two consequences are worth spelling out.
First, the tax can create a bias towards holding in a GIA. If selling a winner costs you thousands, the better idea in question three has to clear a higher bar. That's legitimate.
Letting tax become the only reason you hold a share you'd otherwise sell is a different thing. It's how some portfolios end up dominated by one old position.
Second, the 30-day rule catches a common move. Buy the same shares back within 30 days of selling them in a GIA and HMRC matches the sale with the new purchase, not your original holding (HS284, section 2). So selling to realise a loss or use your allowance, then buying straight back, doesn't work the way people expect.
Selling in a GIA and buying back inside an ISA (often called bed and ISA) is a different transaction. Providers offer it as a service. Our guide to selling shares in a stocks and shares ISA covers the ISA mechanics.
How do you write sell rules in advance?
Write them before you buy, as if-then statements. Keep them somewhere you'll see at review time.
This psychology is well tested. Peter Gollwitzer and Paschal Sheeran pulled together 94 independent tests with 8,461 participants (Advances in Experimental Social Psychology, 2006). Plans written as "if situation X happens, I'll do Y" had an average effect size of d = 0.65 on whether people followed through, which counts as medium to large.
None of those studies were about investing, so the transfer is an assumption. It fits neatly with the Akepanidtaworn finding that sells improved when managers were forced to pay attention.
At FINK we look at it this way: the sell decision is part of the buy decision. That's why our investment thesis template puts what would prove you wrong on the same page as the reasons to buy.
Here's a template you can copy. The thresholds are deliberately blank. They depend on your goals, your time horizon and how much volatility you can live with. They're yours to set.
| Rule | Write it as | Your version |
|---|---|---|
| Thesis | I own this because... | |
| What must stay true | If ... stops being true, I'll sell the whole position | |
| Maximum size | If it grows above ...% of my portfolio, I'll trim back to ...% | |
| Price exit (optional) | If the price closes below ... I'll review within ... days, or sell | |
| Switch bar | I'll only switch if the new idea is better after costs and tax by ... | |
| Cash needs | If I need money for ..., I'll sell ... first | |
| Review date | I'll review this on ... and every ... after that |
A worked example
This is a hypothetical company and a hypothetical investor, for illustration only.
Sam buys shares in a UK software firm, Company X, inside a stocks and shares ISA. Sam's written thesis is that recurring subscription revenue will keep growing as existing customers renew. What must stay true: renewal rates stay high and no single customer is more than a fifth of sales. Sam sets a maximum position size and a review date each quarter after results.
Eighteen months later, three things have happened. The share price is up a lot. The position has grown past Sam's maximum. And the latest annual report shows the biggest customer now accounts for a much larger share of revenue than before.
Running the four questions in order:
- Thesis broken? The customer concentration rule has been breached, so yes. That makes it a full sale under Sam's own rule, regardless of the price gain.
- If the customer data had been fine, question two would have said trim, because the position is above its planned size.
- Question three doesn't arise, because question one already answered it.
Because it's in an ISA, there's no Capital Gains Tax on the sale. In a GIA, Sam would need to work out the gain using the average cost of the holding and check how much of it falls in each tax band.
Sam might be wrong. The customer could stay loyal and the shares could keep rising after the sale. But the decision was made by rules written when Sam was calm, not by how the share happened to feel that week. That's the whole point of writing them.
How often should you review your holdings?
On a fixed schedule, often enough to catch a broken thesis and rarely enough to avoid reacting to noise. For most long-term investors, that means after each set of company results plus an annual check of the whole portfolio.
The Barber and Odean data argues against looking too often, because each look is a chance to trade. The Akepanidtaworn data argues against looking too rarely, because sells made with full attention did much better. A calendar does both jobs.
A simple routine looks like this:
- After each set of results, reread your thesis for that company and check whether anything on the "must stay true" list has changed.
- Each quarter, check every position's size against your maximum.
- Once a year, ask question three across the whole portfolio and update your cash needs. Our annual ISA review checklist covers the ISA side.
- Before any sale, run the four questions in order and write down which one said yes.
- After any sale, note the reason and the date. Over time, that log is the only reliable way to see whether your sells add value or cost you.
If you want help deciding when to bank gains specifically, our guide to when to take profits on long-term stocks goes further. For how selling fits a whole ISA plan, see our stocks and shares ISA strategy guide.