
Can a stocks and shares ISA lose money?
Yes. An ISA is a tax wrapper, not an investment. It shelters whatever's inside it from tax. If that's shares or funds, the value moves with them.
Plenty of people are exposed. HMRC's latest figures put the market value of all ISAs at £952 billion, with 55.8% of it in stocks and shares (HMRC ISA statistics). That's a lot of money that rises and falls with markets.
The Financial Services Compensation Scheme can step in if an investment firm fails, up to its limits, but it doesn't cover falls in value. FSCS says plainly that it can't accept claims for poor investment performance, because investments can go down as well as up (FSCS). So a falling ISA isn't a sign your provider's in trouble. It's the investments doing what investments do.
How often does the UK stock market fall?
More often than most people expect. We took daily closing prices for the FTSE All-Share index from February 1980 to October 2026 and looked at each full calendar year from 1981 to 2025.
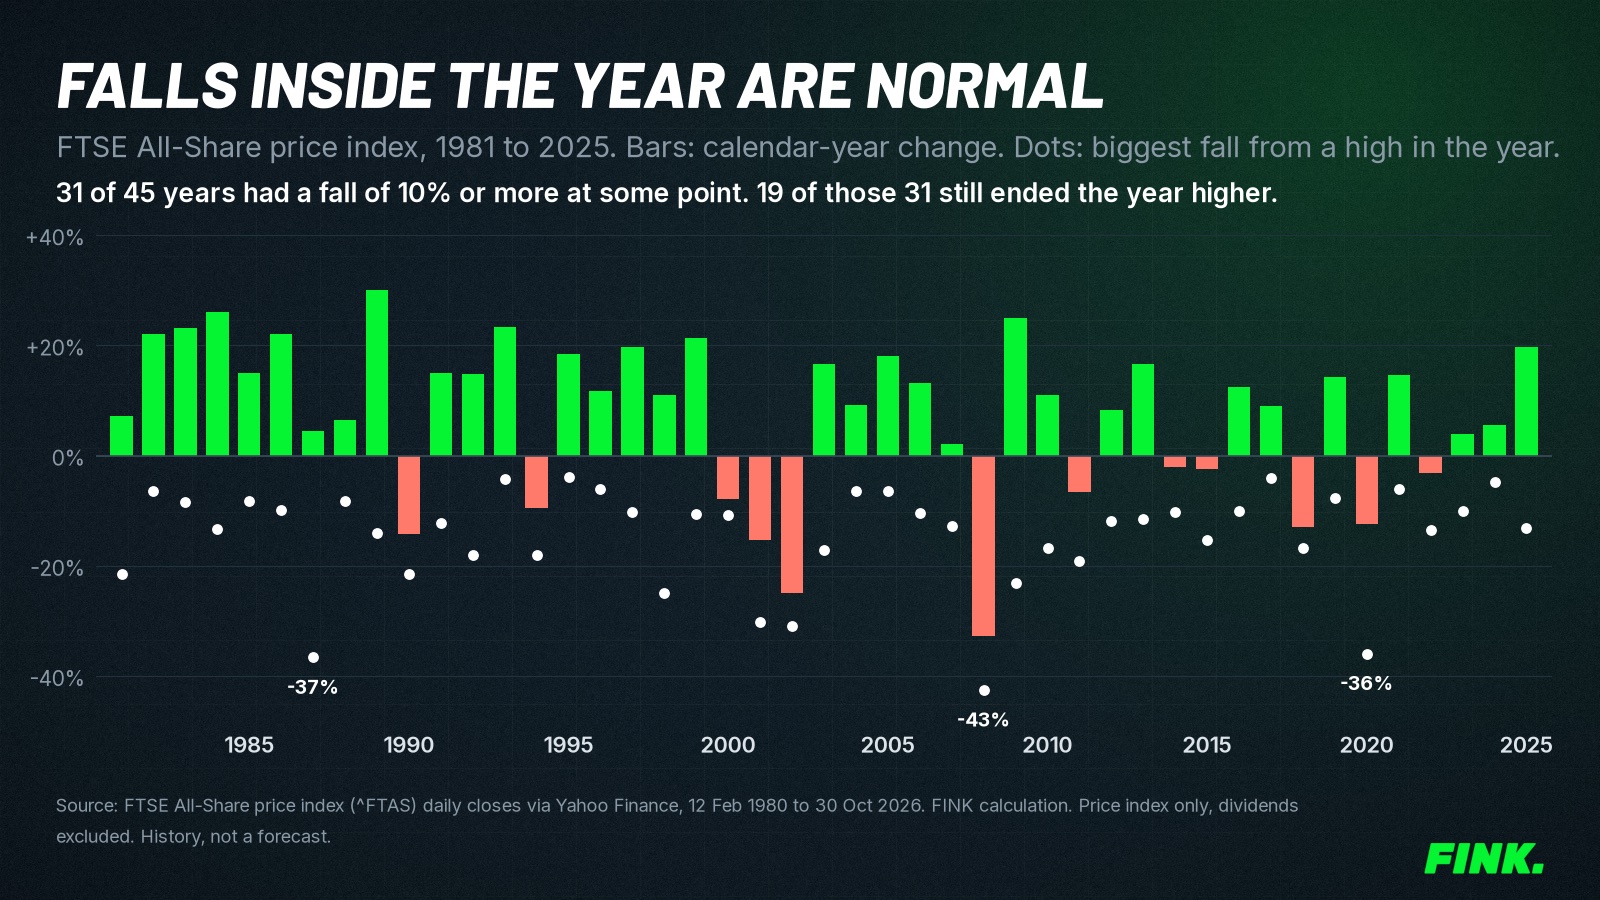 Source: FTSE All-Share price index (^FTAS) via Yahoo Finance. FINK calculation. Price only, dividends excluded.
Here's what the data shows:
| Measure, FTSE All-Share price index, 1981 to 2025 | Result |
|---|---|
| Calendar years analysed | 45 |
| Years that ended lower than they started | 12 |
| Years with a fall of 10% or more from a high at some point | 31 |
| Of those 31, years that still ended higher | 19 |
| Years with a fall of 20% or more at some point | 9 |
| Median biggest fall within a year | 11.8% |
| Worst calendar year | 2008, down 32.8% |
How we worked it out. For each year, we tracked the highest close so far that year and measured the largest drop below it. That's the dot on the chart. The bar is the change from the last close of one year to the last close of the next.
We used the price index, so dividends aren't included. With dividends, the yearly figures would be higher, but the falls within the year would look much the same.
The takeaway isn't that falls don't matter. It's that a 10% drop in a broad UK index has, historically, been an ordinary year rather than a rare event. If your ISA is mostly in UK shares or a UK tracker, a fall that size tells you less than it feels like it does.
How long has the market taken to recover?
Anything from a few months to more than six years, on prices alone. The chart below shows every fall of 15% or more in the FTSE All-Share since 1980 and how long it took the index to close back at its previous high.
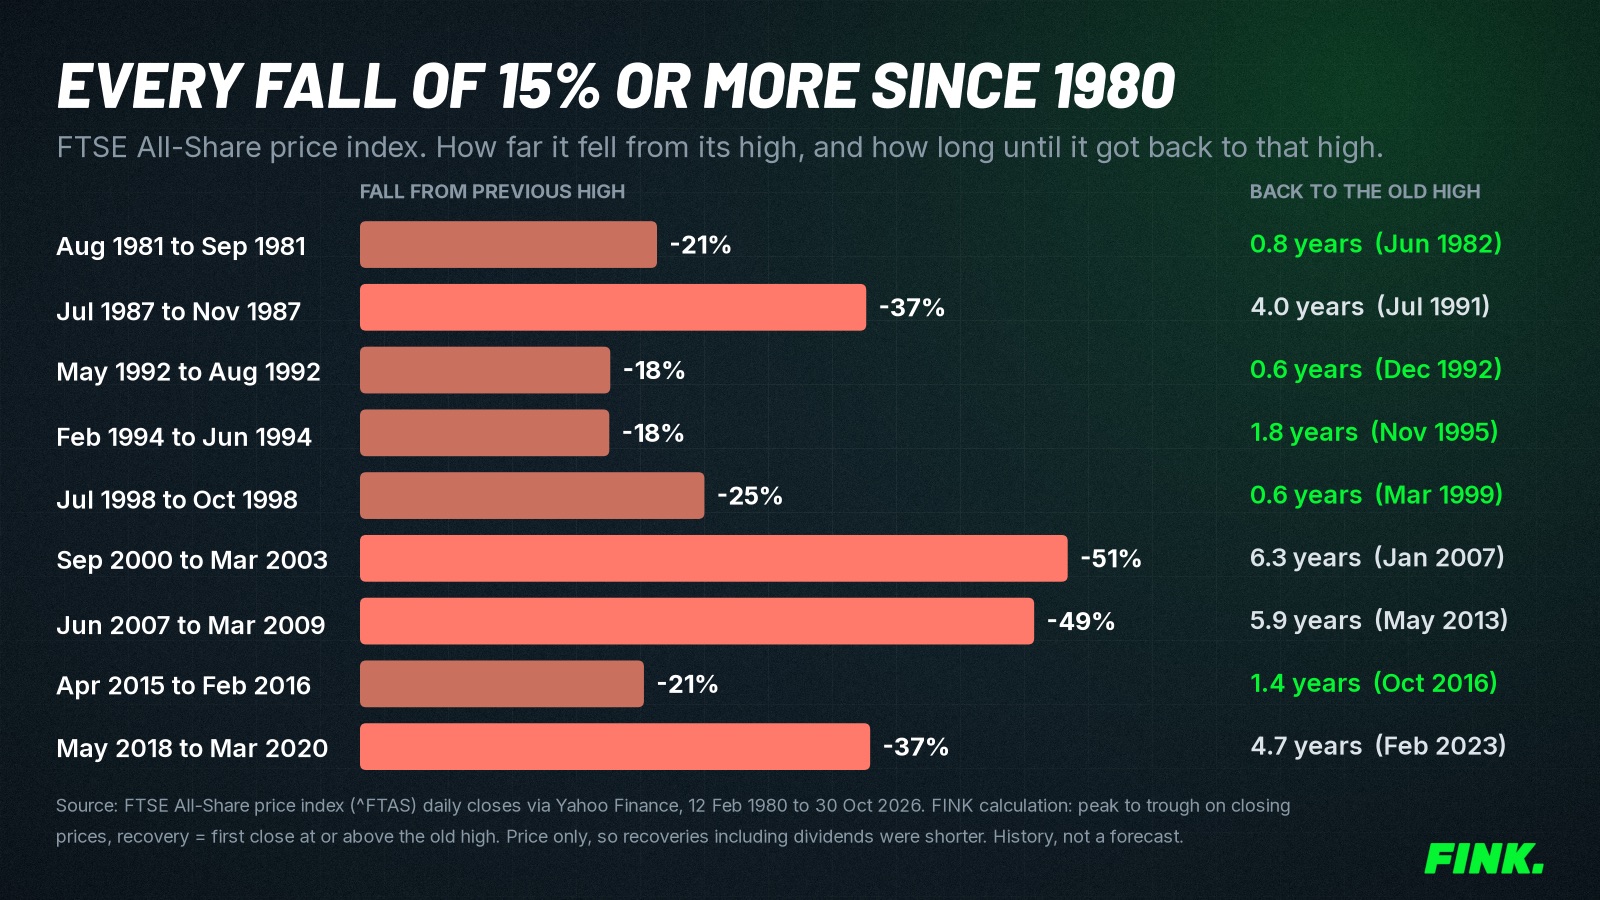 Source: FTSE All-Share price index (^FTAS) via Yahoo Finance. FINK calculation. Price only.
Nine falls hit that size. Five recovered within two years. Four took around four to six years:
- the 1987 crash (down 37%, back to its high after 4.0 years)
- the dotcom bust (down 51%, 6.3 years)
- the financial crisis (down 49%, 5.9 years)
- the 2018 to 2020 slide that ended with the Covid crash (down 37%, 4.7 years)
How we worked it out. A fall starts at a closing high and ends at the lowest close before the index regains that high. Recovery is the first close at or above the old high.
We used closing prices only, so intraday lows were deeper. Because dividends are excluded, a total return measure (which reinvests dividends) would show shorter recoveries.
There's an obvious limit: our data starts in 1980. Other markets have done far worse. Japan's Nikkei 225 peaked at the end of 1989 and didn't close above that record until February 2024, more than 34 years later (Reuters). Past recoveries in the UK aren't a promise of future ones.
Is a fall in your ISA just a paper loss?
For a broad, diversified fund, that's a fair way to describe it, as long as you don't need to sell. For a single company's shares, it's a much weaker comfort.
The paper-loss idea rests on the market as a whole recovering, which it has in the UK so far. Individual companies don't share that record. Hendrik Bessembinder and colleagues studied more than 64,000 stocks worldwide from 1990 to 2020 (Financial Analysts Journal, 2023). They found 57.4% of non-US stocks did worse over that period than one-month US Treasury bills. All of the net wealth created came from just 2.39% of companies.
So the question to ask depends on what's falling:
| What's falling | What the paper-loss argument relies on | What to check |
|---|---|---|
| A global or UK index fund | The whole market recovering in time | Whether your time horizon still fits |
| An active fund | The manager's process still working | Whether the fund's approach or manager has changed |
| A single share | That company recovering, which many never do | Whether the reason you bought it still holds |
| A sector or theme fund | That sector coming back into favour | How much of your ISA it now represents |
If most of your ISA is in a handful of single shares, a fall isn't automatically temporary. It might be, but you have to check the businesses, not the market.
Why do investors sell at the wrong time?
Because falls are uncomfortable and the urge to stop the pain is strong. The data suggests acting on that urge costs money on average, but the research shows the opposite mistake too.
Morningstar compares the returns funds produce with the returns their investors actually get, which depend on when money goes in and out. Over the 10 years to the end of 2024, US fund investors earned 1.2 percentage points less annually than the funds they owned. That gap was about 15% of the funds' total return (Morningstar, Mind the Gap 2025). The study covers US funds rather than UK ISAs, but the behaviour it measures isn't specific to one country.
If this is your first fall, our guide to your first year with a stocks and shares ISA shows how often a new ISA has been below its starting value within twelve months.
The opposite error is holding a falling share purely to avoid admitting a loss. That's the disposition effect. The research behind it sits in our when to sell a stock guide. For a single share that's down, when to sell a stock at a loss covers the tax side too, since losses inside an ISA can't be set against gains elsewhere.
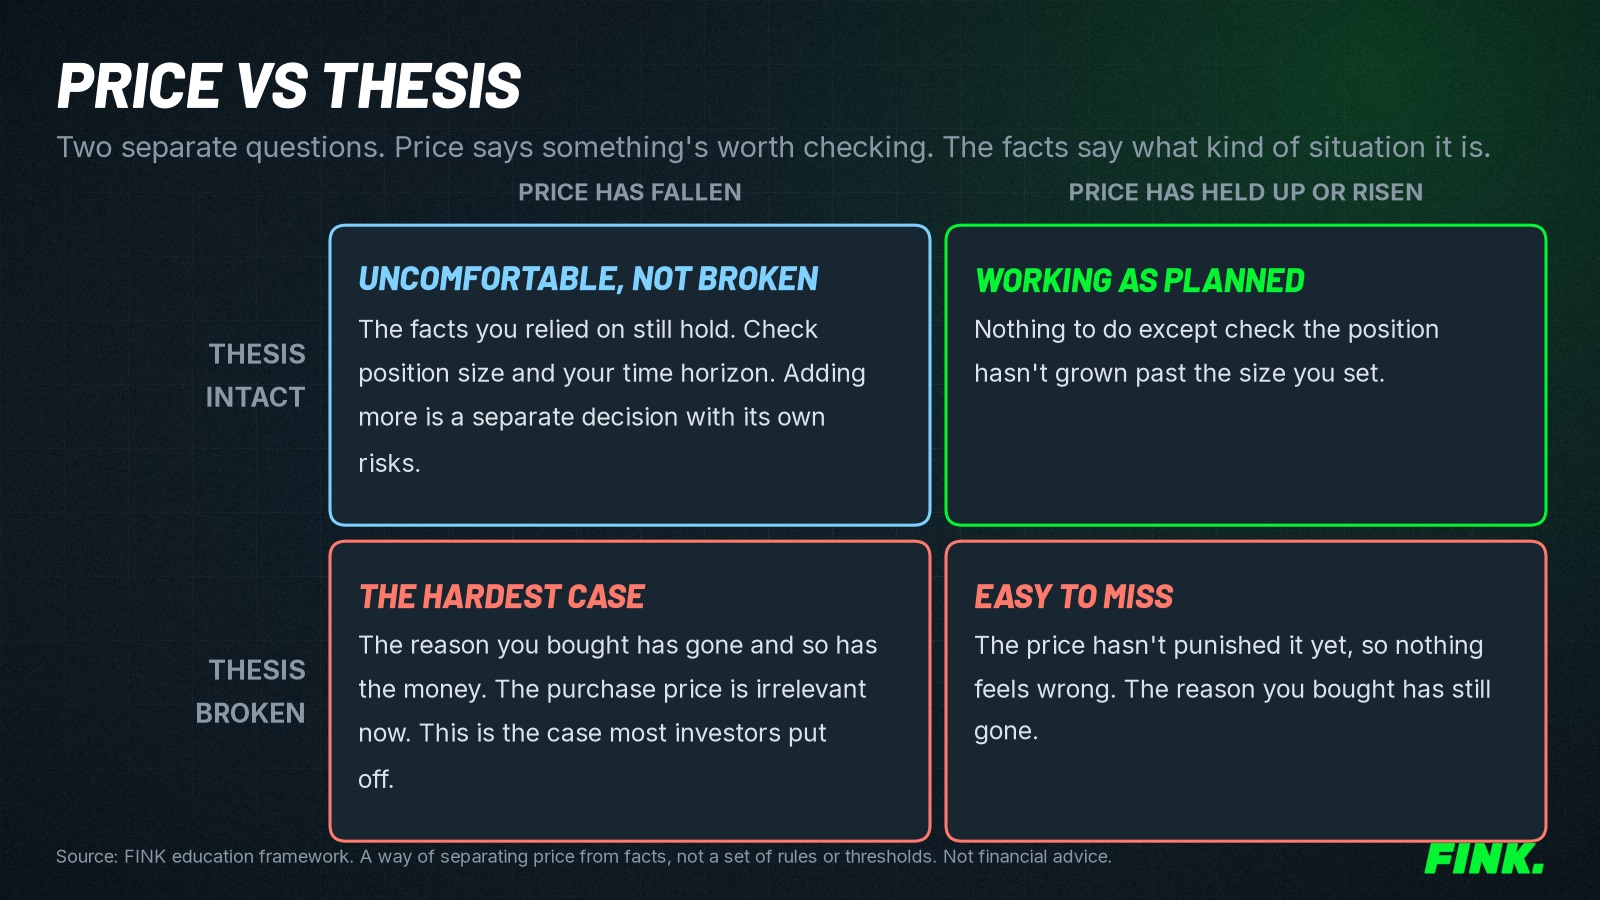
Both mistakes have the same root. The decision gets made by the price and the feeling, not by a plan. One thing we're big on at FINK is separating the two: price tells you something's worth checking. The plan tells you what to do about it.
What should you check before selling?
Five checks, in this order. They take an evening, not a weekend.
- When do you need this money? If it's within the next few years, short-term falls matter much more. The question becomes how much risk your timeline can carry. If it's 10 years away, today's price matters less than the next decade's.
- What do you actually own? List each holding and whether it's a broad fund, a narrow fund or a single share. The table above shows why that changes the answer.
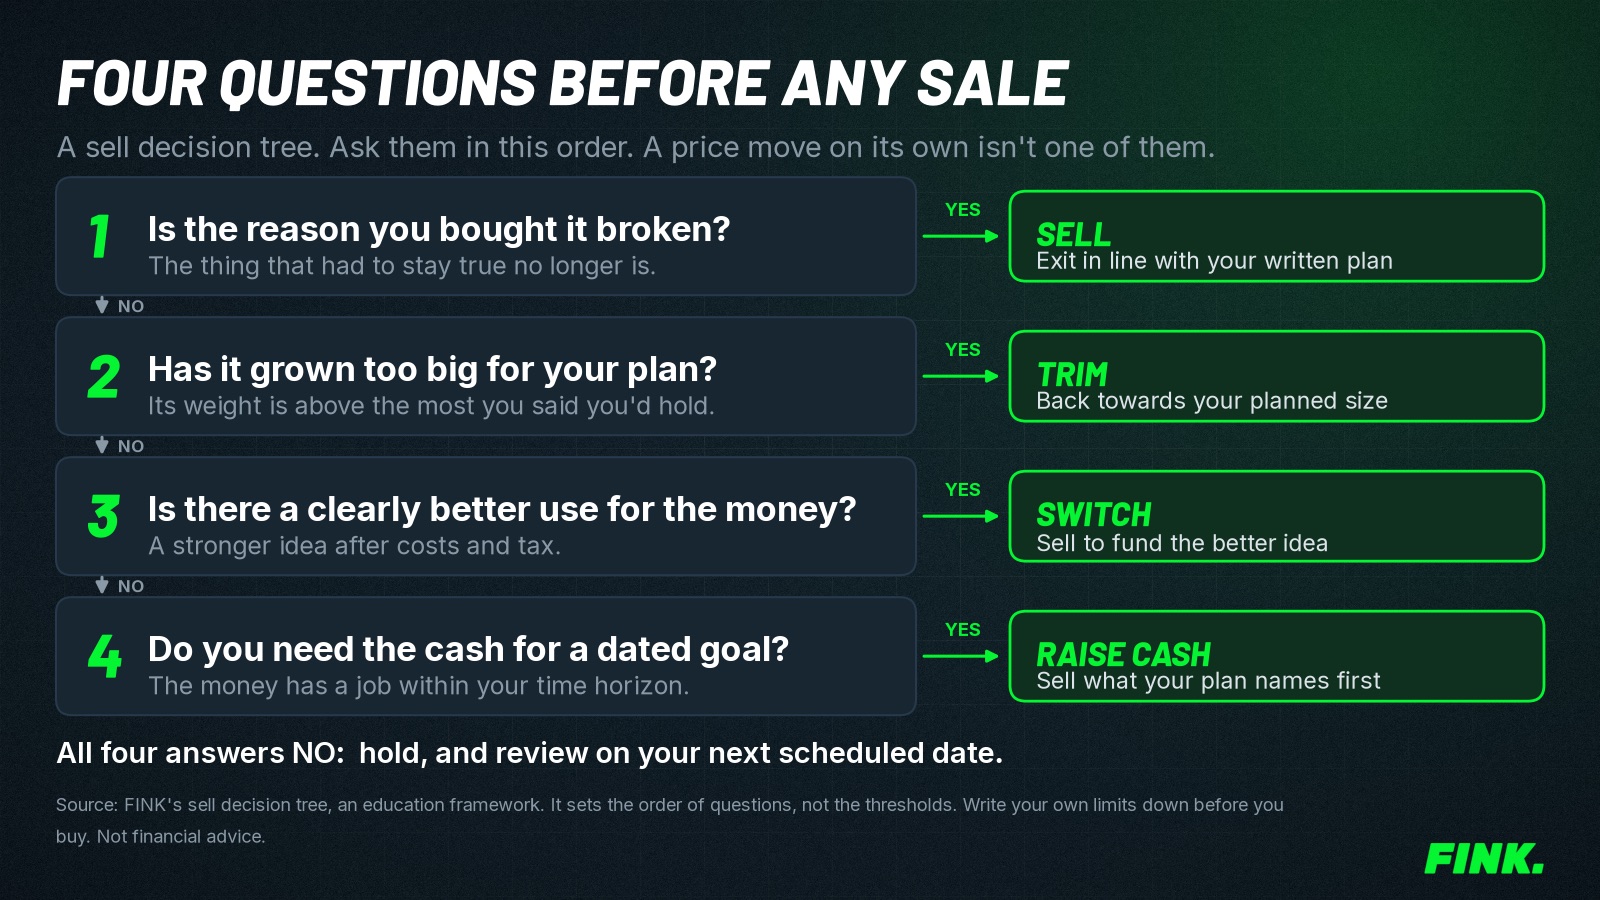
- For each single share, does the original reason still hold? Look for facts: results, a dividend cut, a lost customer, debt. A falling price on its own doesn't answer this. Our guide on when a falling share is worth selling has a four-question decision tree for it.
- Has anything become too big? A fall elsewhere can make one holding a larger share of your ISA than you intended. Check each position against the size you'd planned.
- What would you do with the money instead? Cash inside the ISA, a different fund, or out of the ISA altogether. Each has trade-offs (see below).
If every answer comes back fine, the usual conclusion is that nothing needs doing apart from writing down the date you'll look again.
What are your options if your ISA is down?
There are more than two. Each one has a cost.
| Option | What it does | The trade-off |
|---|---|---|
| Hold and review on a set date | Keeps your plan in place | Losses can grow if a holding's case has broken |
| Keep paying in as planned | Buys more units while prices are lower | Adds money to an investment that may keep falling |
| Sell and hold cash inside the ISA | Stops further falls on that holding, keeps the tax wrapper | You may miss a rebound and face a second decision about when to reinvest |
| Switch to a different investment | Moves money to something you rate more highly | Dealing costs and spreads. The new choice can fall too |
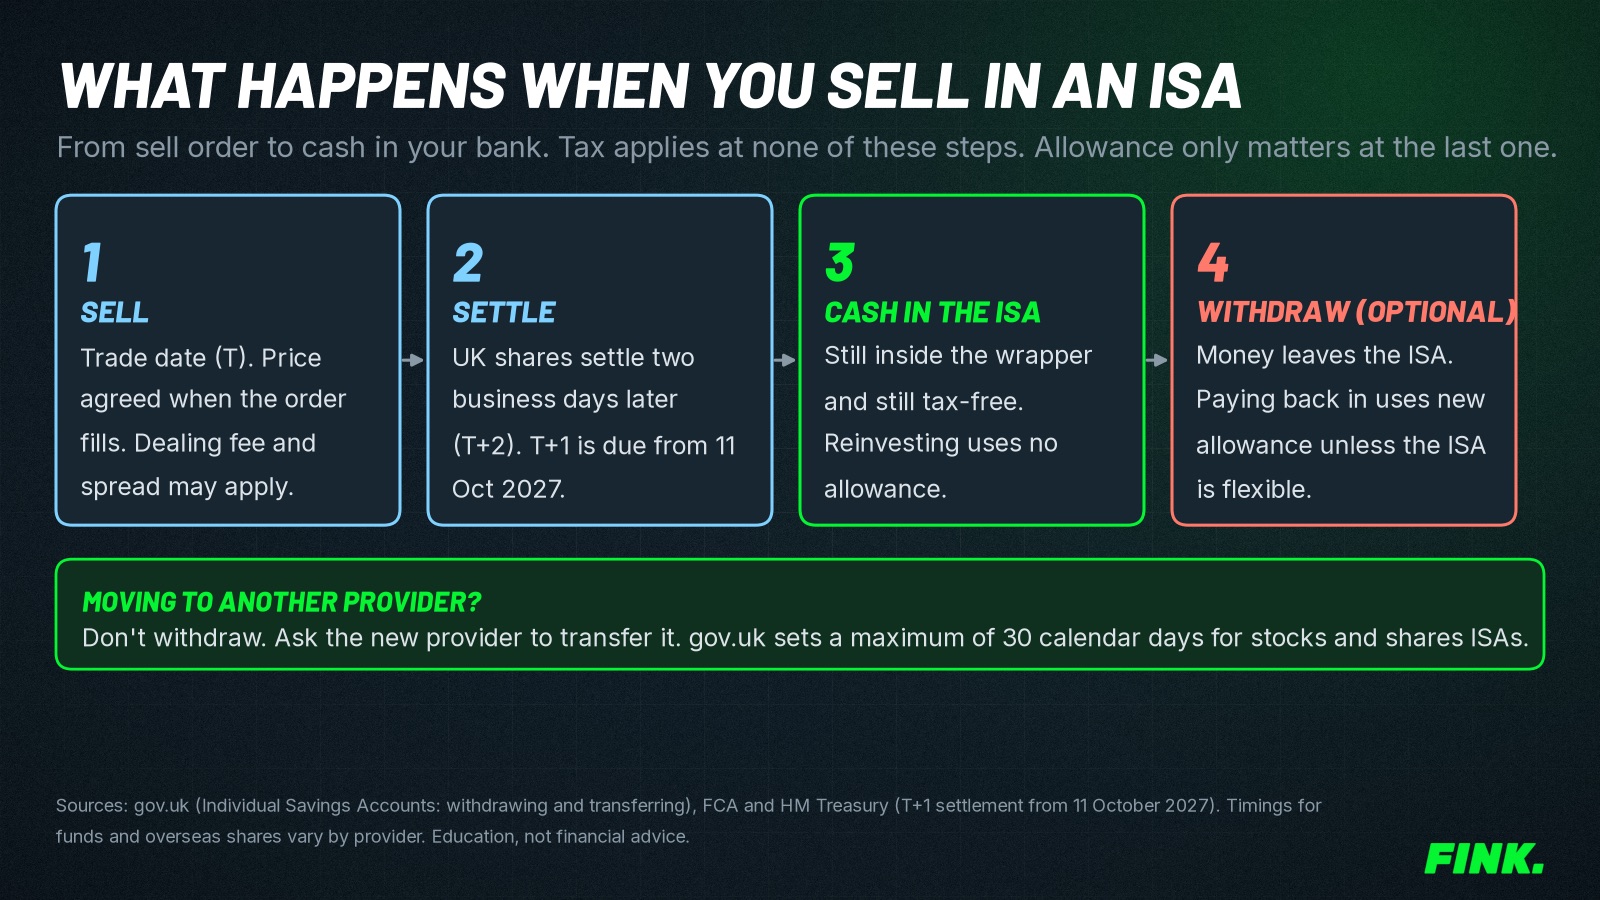
| Sell and withdraw | Gives you the cash | Unless your ISA is flexible, money taken out can't be put back without using new allowance |
On the last point, gov.uk's rules are clear. In a flexible ISA, you can take money out and put it back in the same tax year without it counting towards your £20,000 allowance. In a non-flexible ISA, anything you pay back in counts as a new subscription (gov.uk). Our guide to stocks and shares ISA withdrawal rules covers it in full.
Does selling inside an ISA cost you anything?
Not in tax. You don't pay Capital Gains Tax on gains in an ISA and you don't report sales to HMRC (gov.uk). Selling and buying within the ISA doesn't use any of your annual allowance either.
There are other costs. Your provider may charge a dealing fee. Every trade has a spread between the buying and selling price.
The less obvious one is that a loss inside an ISA can't be used to reduce gains elsewhere. HMRC's guidance for ISA managers says losses on ISA investments can't be set against Capital Gains Tax on gains outside an ISA (gov.uk).
For more on the mechanics, see selling shares in a stocks and shares ISA. For a loss on a single share, when to sell a stock at a loss goes through the evidence and the trade-offs. And for how all of this fits a longer plan, there's our stocks and shares ISA strategy guide.