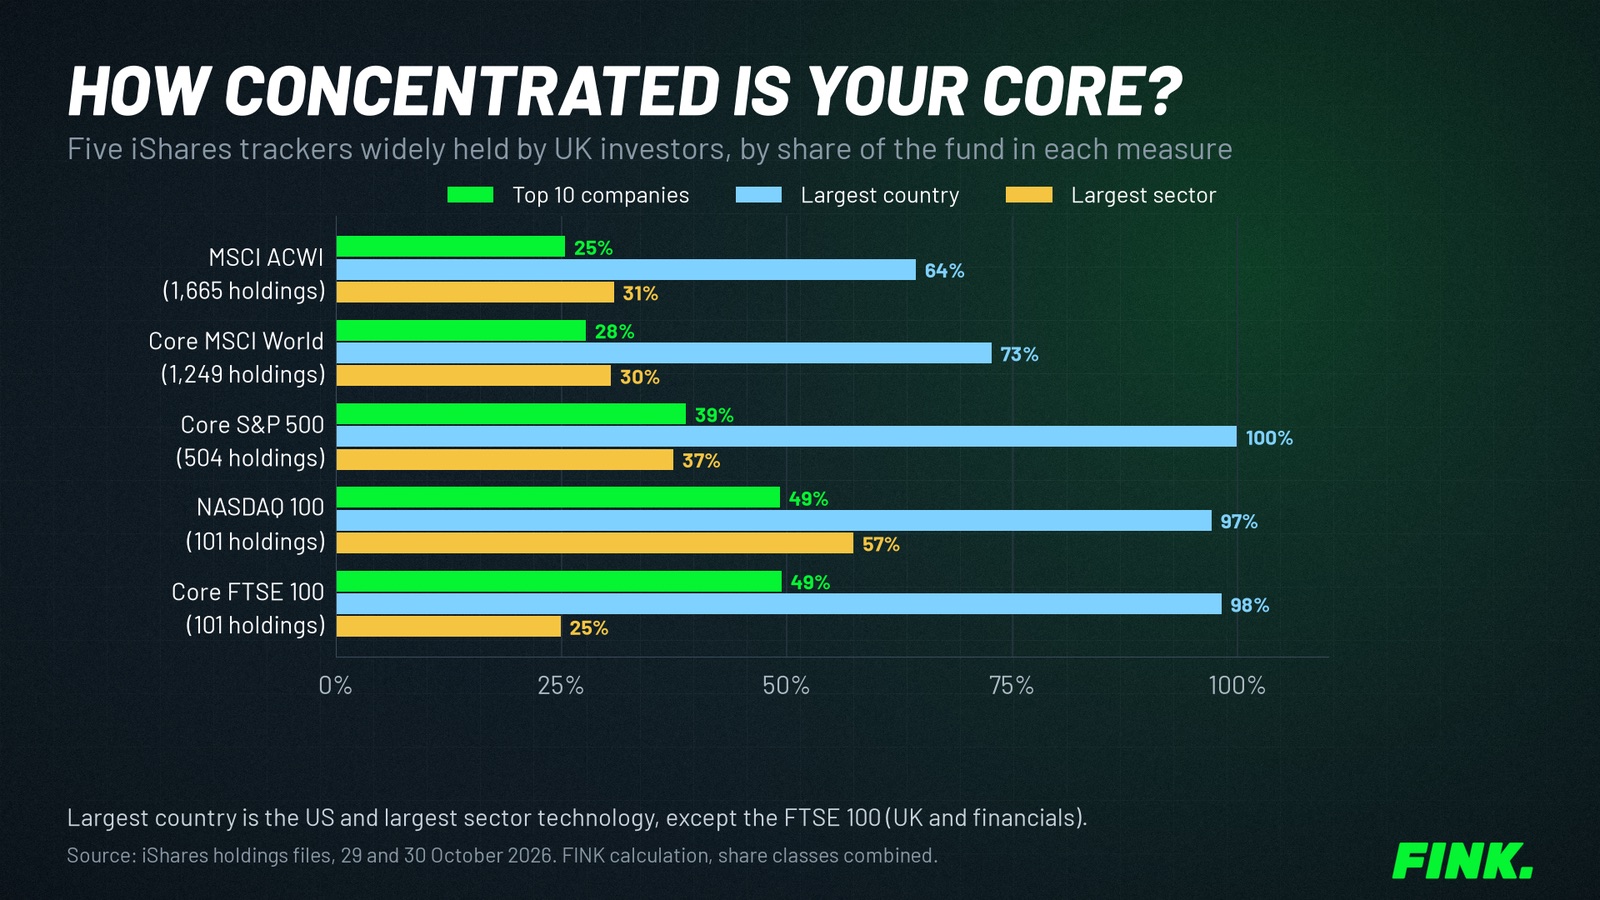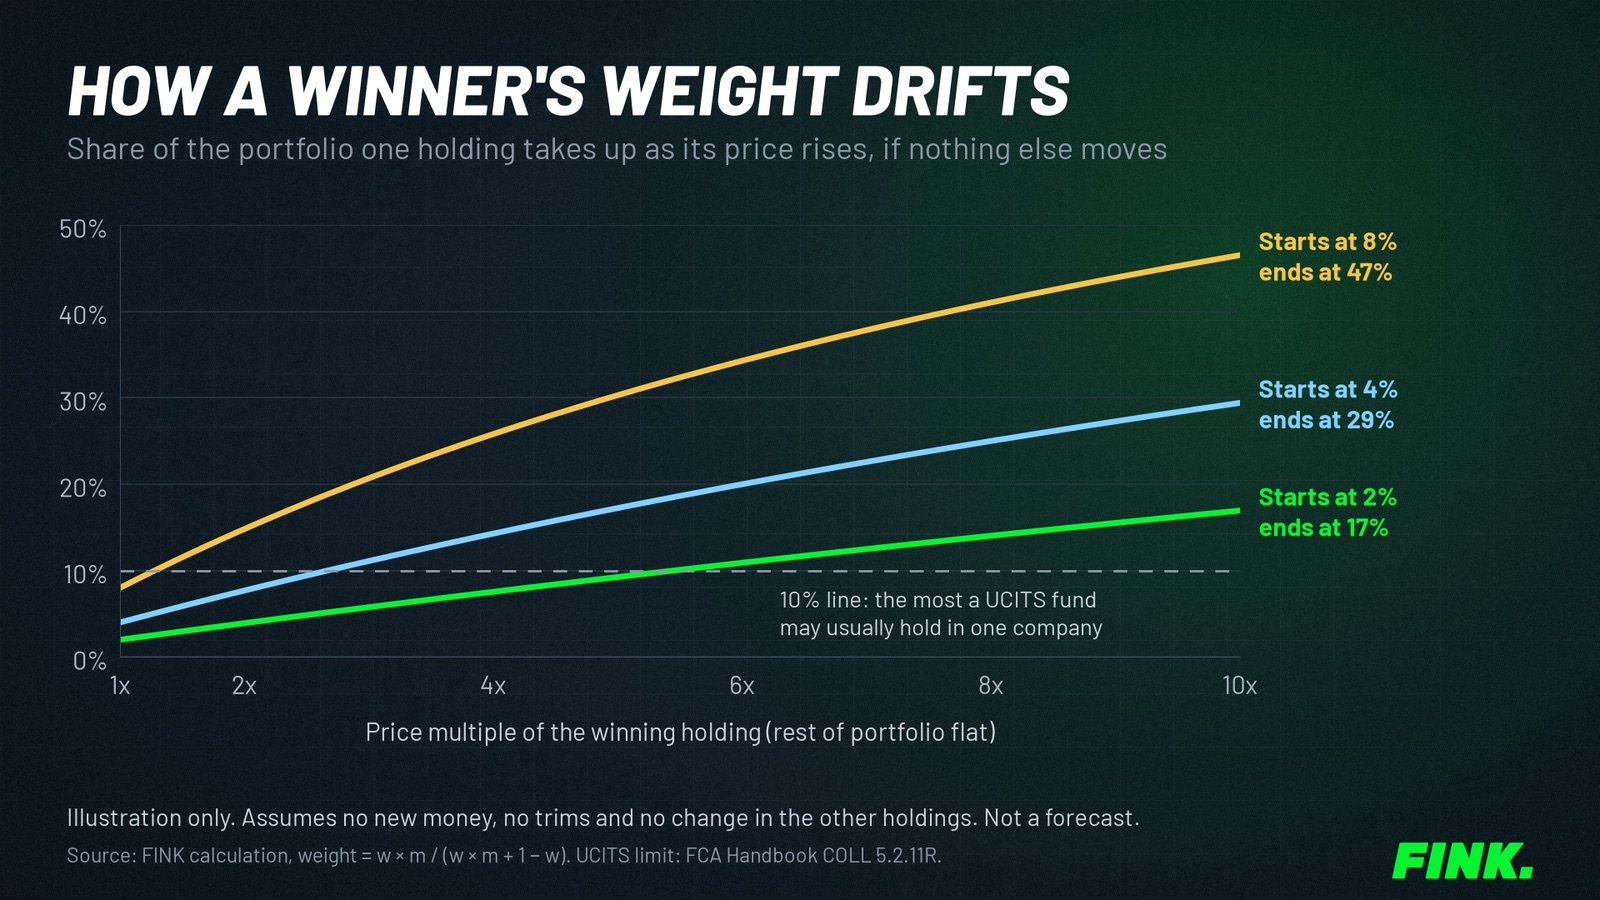

What's fund overlap?
Fund overlap is how much of two funds is invested in the same companies. The useful version weights it by money, not by the number of shared names.
There are two ways people measure it. They give very different answers:
| Measure | How it works | What it tells you |
|---|---|---|
| By count | Shared companies ÷ companies in the smaller fund | Whether the same names appear, however small |
| By weight | For each shared company, take the smaller of its two weights, then add them up | How much of the money is doing the same job |
Take a FTSE 100 tracker and a World tracker. By count they look similar, because 66 of the FTSE 100 tracker's companies also appear in the World fund. By weight they barely overlap, at 3.4%, because those UK companies are tiny inside a global index. Weight is the measure that matters for risk.
How much do popular trackers overlap?
Between global and US funds, more than most people expect. Between global and UK funds, very little. We downloaded the full holdings files for five iShares ETFs widely held in UK ISAs and compared every pair.
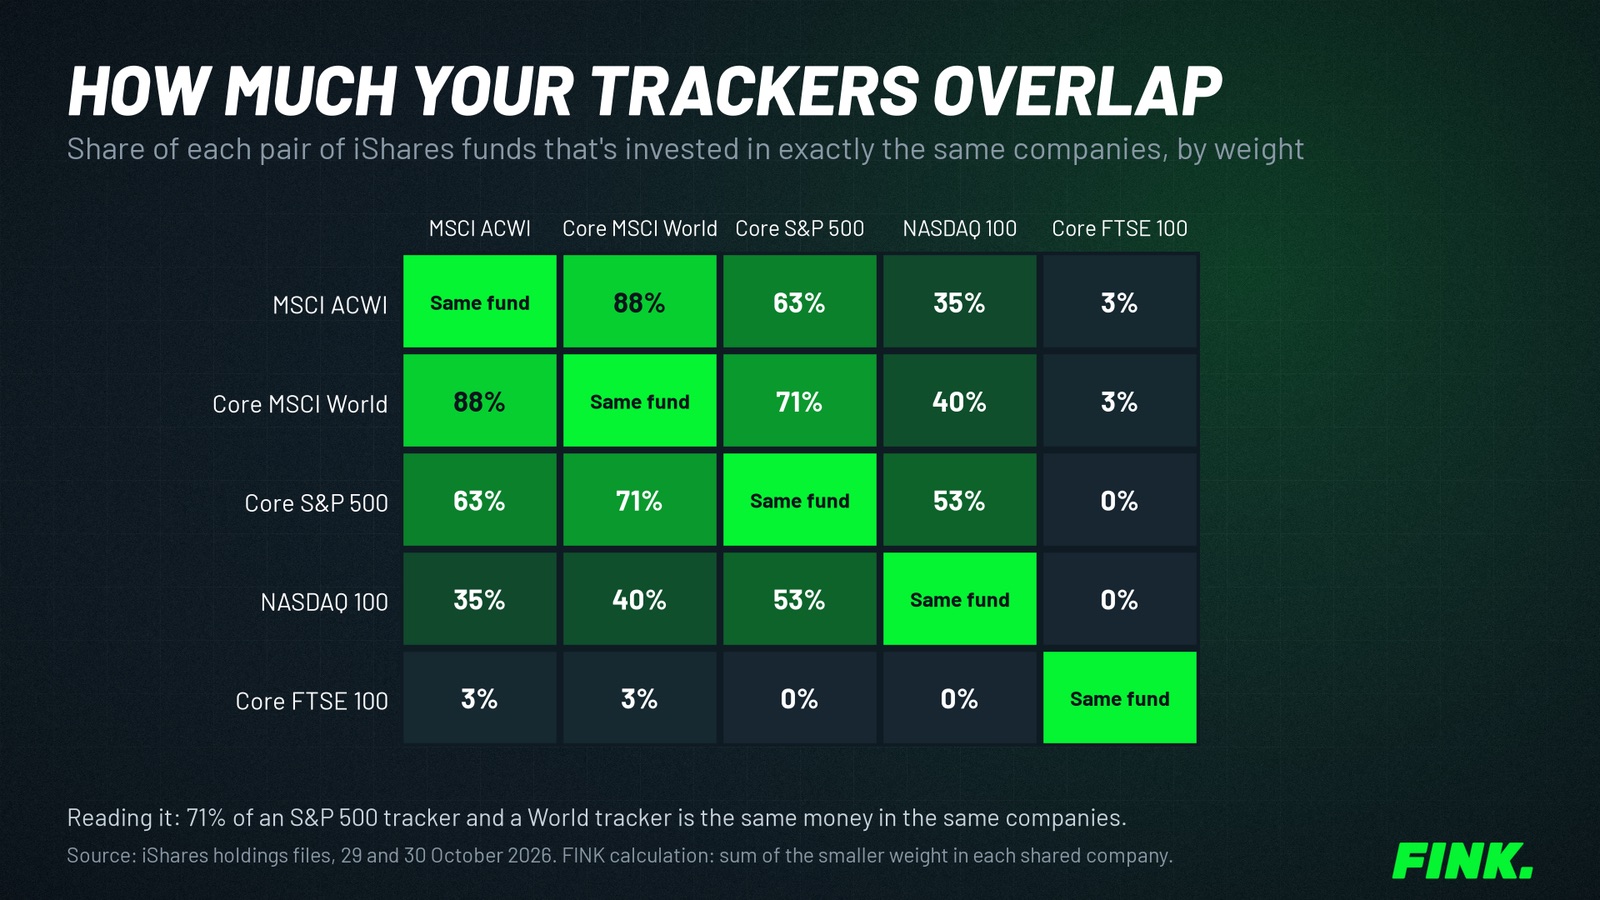
The pairs in more detail:
| Pair | Overlap by weight | Companies in both |
|---|---|---|
| MSCI ACWI and Core MSCI World | 87.8% | 1,224 |
| Core MSCI World and Core S&P 500 | 70.7% | 443 |
| MSCI ACWI and Core S&P 500 | 62.7% | 443 |
| Core S&P 500 and NASDAQ 100 | 53.0% | 86 |
| Core MSCI World and NASDAQ 100 | 39.5% | 98 |
| Core MSCI World and Core FTSE 100 | 3.4% | 66 |
| Core S&P 500 and Core FTSE 100 | 0% | 0 |
Method: equity holdings from each fund's published holdings file, matched by ticker and country. Overlap is the sum, across shared companies, of the smaller of the two weights. Weights as of 29 October 2026 for Core MSCI World and 30 October 2026 for the others.
The direction matters too
Overlap by weight is symmetrical, but the question "how much of fund A is already inside fund B?" isn't.
On our figures, 98.7% of the Core S&P 500 by weight sat in companies the World fund also holds. And 99.0% of the NASDAQ 100 tracker sat in companies the World fund holds. So a World tracker already holds almost all of the weight in those two funds. What adding them changes is the weights.
What happens to your ISA when funds overlap?
Overlap doesn't add new companies. It increases the weight of the ones you already own. We combined the holdings files to show what common mixes do to the whole portfolio. Illustration only.
| Mix | US share | UK share | Top 10 companies | Apple | Nvidia |
|---|---|---|---|---|---|
| 100% Core MSCI World | 73% | 3% | 28% | 5.6% | 5.4% |
| 50% World, 50% S&P 500 | 86% | 2% | 33% | 6.7% | 6.5% |
| 50% World, 25% S&P 500, 25% NASDAQ 100 | 86% | 2% | 36% | 6.8% | 6.6% |
| 50% World, 50% MSCI ACWI | 69% | 3% | 26% | 5.3% | 5.0% |
| 80% World, 20% FTSE 100 | 58% | 22% | 25% | 4.5% | 4.3% |
Method: each fund's company weights multiplied by its share of the mix and added up, with share classes of the same company combined.
Three things stand out:
- Adding an S&P 500 tracker to a World tracker is mostly a US overweight. It lifts the US share by about 14 points and puts a third of the money in ten companies.
- Adding a NASDAQ 100 tracker on top changes little more. It nudges up the top 10 again because it's even more concentrated in the same names.
- Pairing a World tracker with an ACWI tracker is almost pure duplication. It only adds a small slice of emerging markets.
None of this is wrong if it's what you intend.
The interactive investor Portfolio Dilemma column in July 2026 put it this way: holding both "can mean doubling down on some of the holdings". It also noted that the US was around 72% of the iShares Core MSCI World at the end of May 2026.
Is overlap always a problem?
No. Overlap is a problem when it's accidental, not when it's chosen. There are good reasons people hold overlapping funds.
- A deliberate tilt. Someone who wants more US exposure than a global index gives can add an S&P 500 tracker on purpose. The key is knowing the result is about 86% US, not "global plus a little extra".
- Platform or cost reasons. A pension and an ISA on different platforms may each hold a global fund because that's what's available.
- Transition. Moving from one fund to another over time creates temporary overlap.
The case against accidental overlap is that it gives a false sense of diversification. Three funds with different names can behave like one. That matters most in the kind of sell-off where you'd want them to behave differently. The ii column also pointed out that both the World index and the S&P 500 lagged many other markets in 2025.
What reduces overlap
If the aim is to spread money more widely rather than to tilt, the common options are:
| Approach | Example | Trade-off |
|---|---|---|
| One global fund only | A single World or All-World tracker | Accepts the index's own US weight |
| US fund plus world ex-US fund | ii mentions an MSCI World ex-USA ETF paired with an S&P 500 tracker | Two funds to rebalance |
| Regional building blocks | Separate US, UK, Europe, Japan and emerging market trackers | More decisions and rebalancing |
| Global plus a non-overlapping region | World tracker plus a UK tracker | Raises UK share, a home bias some want and some don't |
Trustnet reported a similar warning back in October 2023. Bestinvest's Jason Hollands said that with global and US funds, "there is a high chance that you will just be doubling up positions in many of the same stocks".
Does overlap affect individual shares too?
Yes. This is where most hidden concentration comes from. If you own Apple or Nvidia directly as well as a tracker, your real exposure is the two added together.
On 30 October 2026, Apple was 7.70% of the iShares Core S&P 500 and Nvidia 7.58%. Take a £20,000 ISA with £15,000 in that fund and £1,500 in Nvidia shares bought directly:
- Nvidia through the fund: £15,000 × 7.58% = £1,137
- Nvidia held directly: £1,500
- Total Nvidia exposure: £2,637, or 13.2% of the ISA
The platform shows a 7.5% Nvidia holding. The real figure is above the 10% that a UCITS fund can usually hold in one company under the FCA's spread rules. Our guide to how big a single holding should be covers how to size positions with this in mind.
How do I check fund overlap in my own ISA?
Download each fund's holdings file and compare them in a spreadsheet. It takes about 20 minutes the first time.
- Find the holdings file. Most ETF providers publish the full list of holdings as a downloadable CSV or Excel file on the fund's page, usually under "Holdings". Fund factsheets often show only the top 10, which isn't enough.
- Put each fund on its own sheet. Keep the company name or ticker and the weight column.
- Build a master list of every company that appears in any of your funds.
- Look up each company's weight in each fund, using zero where it's missing.
- For overlap between two funds, take the smaller of the two weights for each company and add them up.
- For your total exposure, multiply each fund's weights by the pounds you hold in it, then add any shares you own directly.
- Sort by total exposure. The top 10 lines show where your ISA really sits.
A few practical notes:
- Match carefully. The same company can appear under slightly different names. Some have more than one share class, such as Alphabet A and C.
- Use the same date for each fund if you can. Weights move every day, though not by much over a few days for broad trackers.
- Third-party tools exist, such as free ETF overlap calculators. Check which funds and dates they use, as many are built around US-listed ETFs rather than the UCITS versions sold in UK ISAs.
How many funds do you actually need?
Fewer than many ISAs hold, if the funds overlap heavily. The overlap table suggests that a single global tracker already contains nearly all of the companies in the most popular US funds.
That doesn't settle how many funds to own. It depends on whether you want a tilt, how much you want in the UK and whether you hold individual shares as well. Our guide to how many funds to hold in a stocks and shares ISA looks at that question. The core and satellite guide shows one way to keep a broad core separate from deliberate extra positions.
At FINK we look at it this way: every fund in an ISA should have a job you can state in one line. If two funds have the same job, overlap is usually the reason. Our ISA strategy guide sets out where fund choice fits in a wider process.