
Why is "what should I buy?" the wrong first question?
Because the right holding depends on what the money is for, how long you'll hold it and what you already own. Most "best ISA investments" lists skip that step and go straight to names.
Three questions come first:
- What's the money for and when might you need it? The UKPersonalFinance community's Investing 101 guide suggests not investing money you expect to need within five years.
- What role should each holding play? A core holding provides broad market exposure. Any satellite holdings are smaller, deliberate bets.
- What do you already own? A workplace pension, existing funds or company shares all count towards your total exposure.
Only then does the question of specific funds or shares make sense. Our stocks and shares ISA strategy guide sets out a full process from allocation to selling.
What does the evidence say about index funds versus picking investments?
Long-term data favours low-cost index funds for most of a portfolio, though it doesn't rule out active choices. Two bodies of research stand out.
Active funds versus their index
S&P Dow Jones Indices' SPIVA scorecards have found that most active equity funds sold in sterling lagged their benchmarks over ten years, with UK smaller-company funds the main exception. Our core and satellite guide has the full category table and how SPIVA handles funds that closed. Some active funds do beat their benchmark over long periods. The difficulty is identifying them in advance.
Individual shares
Most individual US stocks between 1926 and 2016 returned less than Treasury bills over their lifetimes, while about 4% of companies produced all of the market's net gain (Bessembinder, 2018). We look at what that means for how much to put in one company in how much to invest in one stock.
That cuts both ways. Owning a broad index means you hold the few big winners, whoever they turn out to be. Picking a handful of shares gives a chance of beating the market and a higher chance of lagging it. Our guide to individual shares or funds in an ISA goes into this trade-off in more depth.
At FINK we look at it this way: most of the evidence points to a broad, cheap core. Anything beyond that needs a written reason and a sensible size.
What should you check before buying any fund?
Six checks cover most of what matters. Run them on any fund, whether it's an index tracker or actively managed.
| Check | What to look for | Where to find it |
|---|---|---|
| What it holds | The index or strategy, number of holdings and regions | Factsheet and holdings file |
| Cost | Ongoing charge figure (OCF) plus any platform fee on top | Factsheet, key information document |
| Concentration | Share of the fund in its top 10 holdings and largest country | Factsheet |
| Overlap | How much it shares with funds you already hold | Compare holdings files |
| Income type | Accumulation or income units | Fund name ("Acc" or "Inc") |
| Value | The manager's own assessment of value, for UK-authorised funds | Annual report or composite value report |
Concentration is worth checking because many popular funds are less spread out than their names suggest. A global tracker can have a large share in one country and its top few companies. Overlap matters for the same reason. Holding a global tracker and a US tracker together can double up on the same companies.
Charges matter because they come off every year regardless of performance. Over long periods, small differences compound. Our annual ISA review checklist shows the effect of different charge levels over 20 years.
For income type, our guide to ISA dividends explains the difference between accumulation and income units.
Does the fund manager think it's good value?
UK-authorised funds have to tell you. Since September 2019, the FCA has required authorised fund managers to carry out an assessment of value at least once a year and publish the conclusion. That includes whether the charges on each unit class are justified by the value delivered and what they'll do if not (FCA, COLL 4.5.7R and 6.6.20R). The report has to come out within four months of the fund's accounting year end, often as one composite document covering the manager's whole range.
It's a useful read because it's the manager marking its own homework in public. Three things are worth looking for. Whether the fund is rated as good value at all, how it's done against the comparator benchmark it names and whether a cheaper unit class of the same fund exists. The FCA's own review of these assessments found quality varied between firms, so treat a glowing report as one input, not a verdict.
The rule covers UK-authorised funds such as OEICs and unit trusts. Many ETFs sold to UK investors are domiciled elsewhere (often Ireland) and don't publish a UK assessment of value. For those, the factsheet's tracking difference (how far the fund's return has trailed its index, after costs) does a similar job.
How do you research an individual company?
Start with the company's own published results, not commentary about it. Every UK-listed company publishes annual results and an annual report. The FCA's National Storage Mechanism holds regulated filings for UK-listed companies.
The worked example below uses RELX, a FTSE 100 information and analytics group, because its 2025 results set out the numbers clearly. This isn't a recommendation to buy, hold or sell RELX. It's a demonstration of what to look for in any company's results.
Step 1: What does the business sell and where?
RELX's results for the year to 31 December 2025, published on 12 February 2026, split revenue by segment, region and type.
| Revenue breakdown, 2025 | £m | Share of total |
|---|---|---|
| Risk | 3,485 | 36.3% |
| Scientific, Technical & Medical | 2,714 | 28.3% |
| Legal | 1,806 | 18.8% |
| Exhibitions | 1,186 | 12.4% |
| Print and print-related | 399 | 4.2% |
| Total | 9,590 | 100% |
| North America | 5,595 | 58.3% |
| Subscriptions | 5,190 | 54.1% |
Source: RELX 2025 results. Shares of total are our calculation.
What this tells a reader: well over half of revenue comes from North America, so the US dollar matters. The company says so itself in its risk section, calling the US "our most important market". Just over half of revenue is subscriptions, which tend to be more predictable than one-off sales.
Step 2: How much of the revenue becomes profit?
RELX reported an adjusted operating margin of 34.8% in 2025, up from 33.9%. Reported operating profit was £3,027m against adjusted operating profit of £3,342m.
The gap matters. Companies define "adjusted" figures themselves. In this case the main difference was £248m of amortisation of acquired intangible assets, which the company excludes from adjusted profit. Reported operating profit as a share of revenue works out at 31.6% on our calculation.
A useful habit is to note both figures and understand what's excluded. A company whose adjusted and reported numbers drift far apart deserves a closer look.
Step 3: Does profit turn into cash?
RELX reported adjusted cash flow conversion of 99%, meaning adjusted cash flow of £3,301m against adjusted operating profit of £3,342m. That's the company's own definition, so it's worth checking what it includes. Capital expenditure was £525m, most of it capitalised development spending on new products.
Step 4: Where does the cash go?
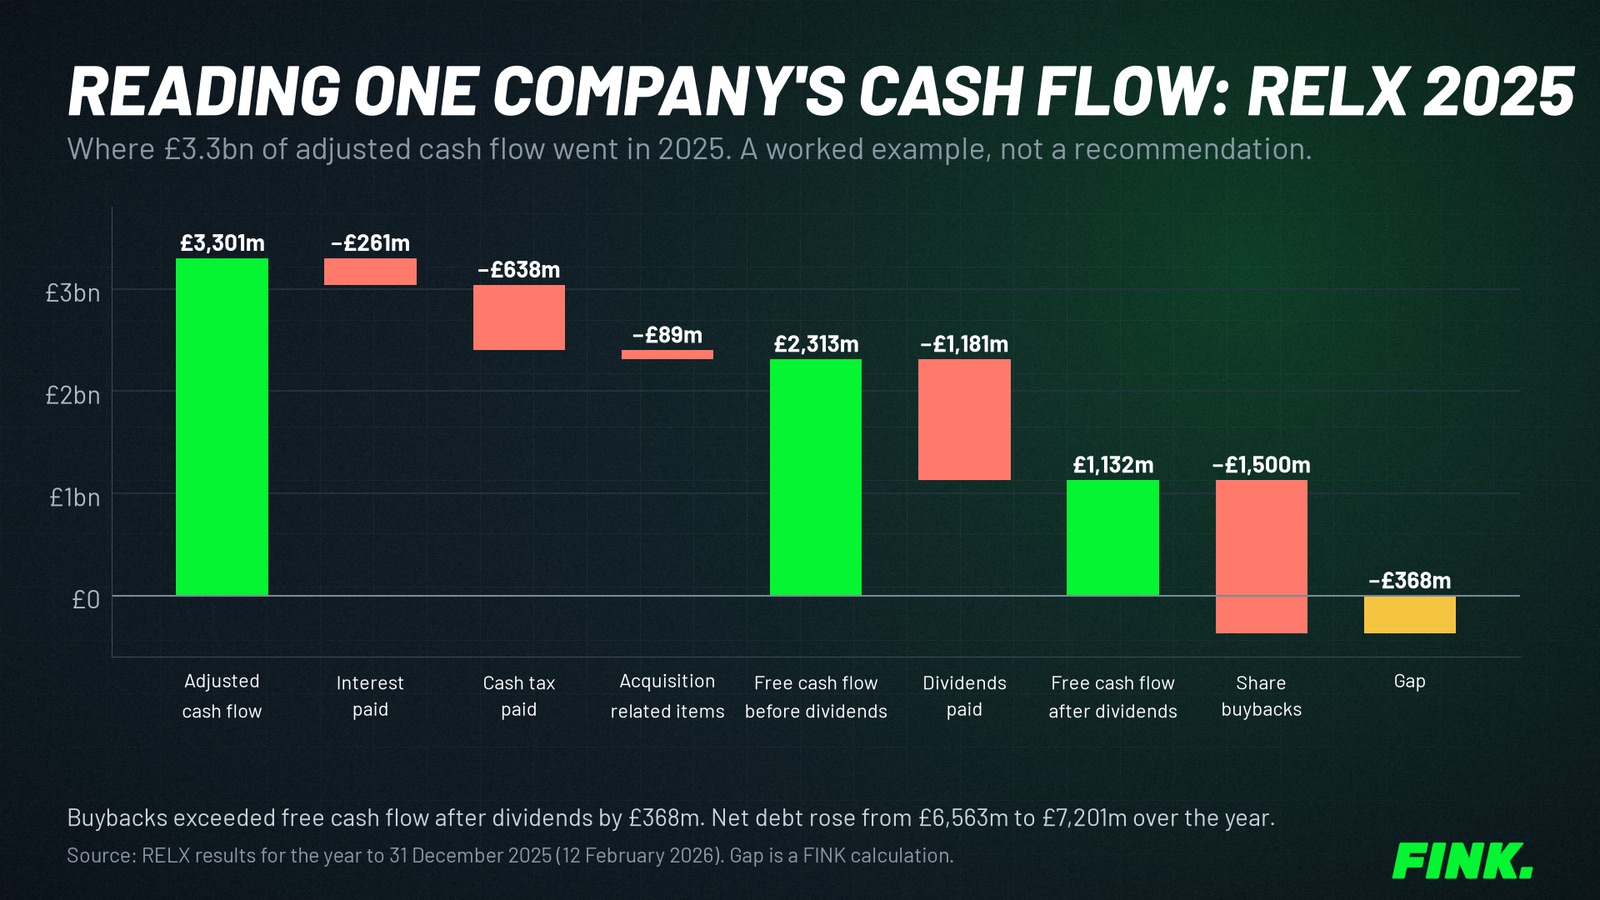
After interest, tax and acquisition costs, free cash flow before dividends was £2,313m. RELX paid £1,181m in dividends, leaving £1,132m. It then spent £1,500m buying back its own shares.
That's £368m more than the free cash flow left after dividends. It's one reason net debt rose from £6,563m to £7,201m during 2025. The company also completed acquisitions for a total of £270m. Net debt was 2.0 times EBITDA, up from 1.8 times.
None of this is good or bad on its own. Some companies fund part of their buybacks with debt when they're comfortable with their borrowing level. The point for a reader is to notice it and decide whether the debt level fits the business.
Step 5: Is the dividend covered?
RELX proposed a full year dividend of 67.5p against adjusted earnings per share of 128.5p. That's cover of about 1.9 times on our calculation. On reported earnings per share of 112.6p, cover is about 1.7 times. Free cash flow before dividends covered dividends paid about twice.
Step 6: What does the company say could go wrong?
Every annual report has a principal risks section. RELX's 2025 results list risks including changing payment models in scientific research publishing, shifts in customer demand driven by technology such as artificial intelligence, cybersecurity and exchange rate movements. Reading this section is one of the fastest ways to understand what could change the picture.
Summary of the walk-through
| Area | What RELX's 2025 results show |
|---|---|
| Products | Information and analytics across four main segments |
| Geography | 58.3% of revenue from North America |
| Revenue type | 54.1% of revenue from subscriptions |
| Profitability | 34.8% adjusted operating margin, 31.6% reported |
| Cash conversion | 99% adjusted cash flow conversion (company definition) |
| Use of cash | Dividends £1,181m, buybacks £1,500m, acquisitions £270m |
| Debt | Net debt £7,201m, 2.0 times EBITDA |
| Dividend cover | About 1.9 times adjusted earnings |
This is the start of research, not the end. Price and valuation, competition and how the business might change over five to ten years all come next.
What should you write down before buying a share?
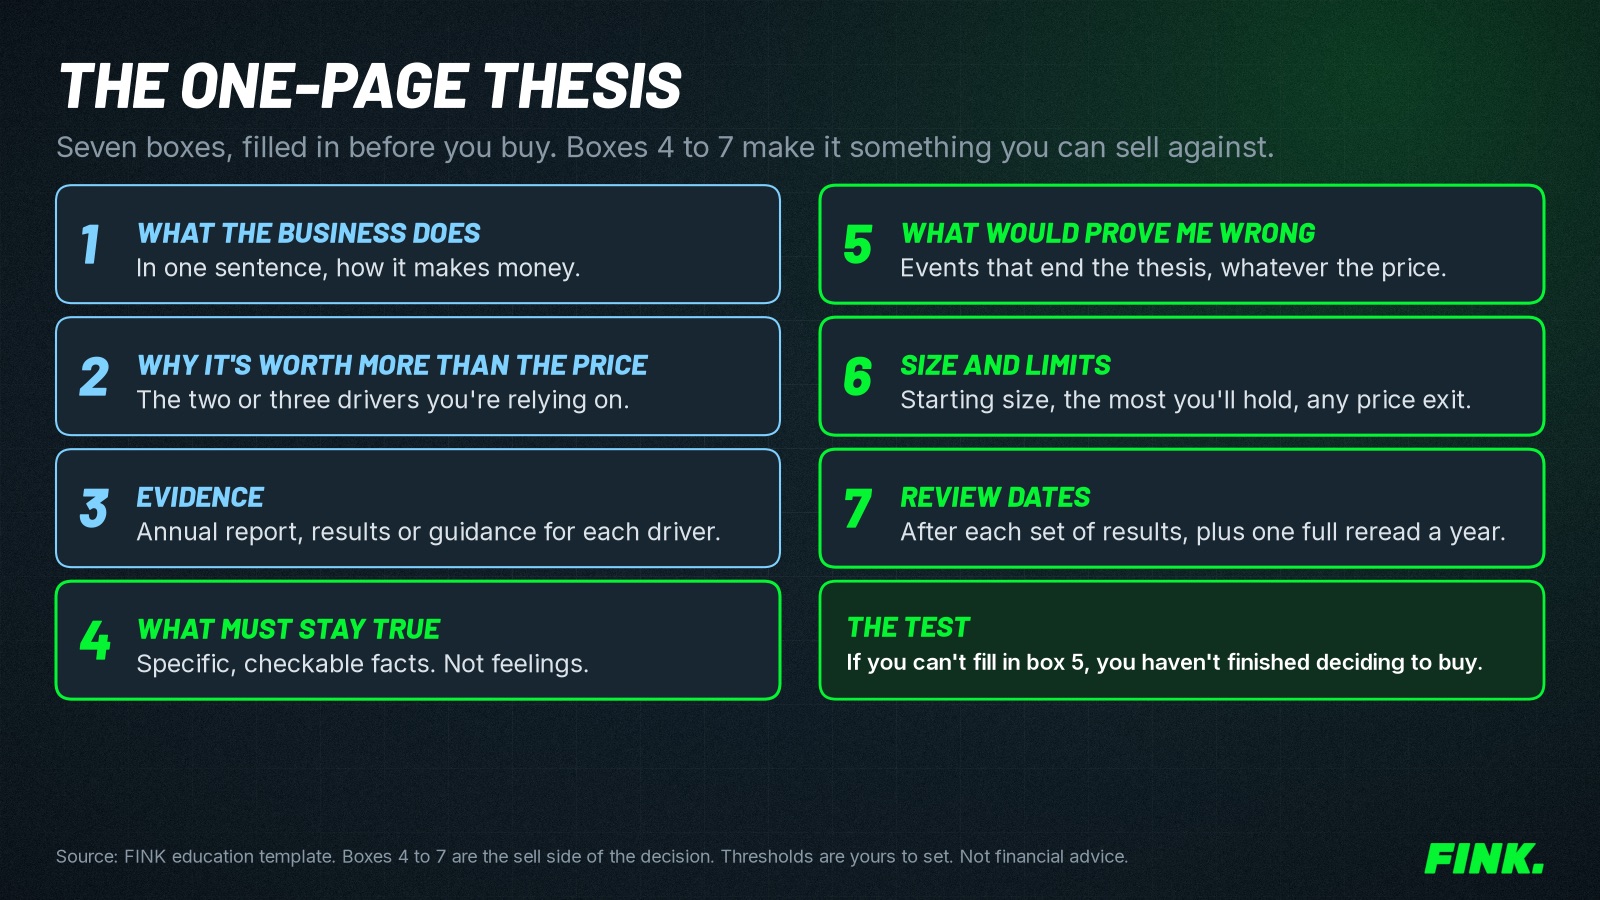
A short written thesis, a size and a reason to sell. Writing it down makes the decision checkable later.
- Why this company? Two or three sentences on what you expect the business to do.
- What would prove you wrong? Specific signs, such as falling cash conversion or rising debt without a clear reason.
- How much? A size you could afford to lose without changing your plans. Our position sizing guide covers the principles.
- When would you sell? Our guide to deciding when to sell sets out common reasons and the evidence on each.
Our investment thesis template gives a one-page format for this.
What do Reddit users suggest putting in an ISA?
The UK personal finance community tends to point beginners to global index funds. The UKPersonalFinance wiki's Investing 101 says funds that spread money across thousands of companies should, for most people, "be the default approach to diversification".
That matches the SPIVA evidence above. Online forums are useful for questions and experiences. They're less reliable for specific share tips, which often reflect recent performance more than research.